

Key Notes
- Solana is trading around $151, up by 2% in the past day.
- A long-term cup-and-handle pattern suggests a major bullish breakout could be near.
- Clearing the $153.65 resistance may propel SOL to $180, according to analysts.
Solana SOL $148.2 24h volatility: 0.6% Market cap: $76.67 B Vol. 24h: $4.29 B is currently trading around $151 after posting a 2% gain in the past 24 hours. The sixth-largest cryptocurrency appears to be flirting with a major breakout , according to market analysts.
Renowned analyst Ali Martinez recently noted that Solana has been quietly forming a textbook cup-and-handle pattern on the weekly chart since late 2021.
Zooming out, #Solana $SOL appears to form a textbook-perfect cup and handle pattern! pic.twitter.com/91oYYgY0yL
— Ali (@ali_charts) April 28, 2025
At present, SOL is in the “handle” phase of the pattern, consolidating just below key resistance levels.
Crypto trader Kamil also noted a major uptick in Solana’s Social Volume metrics, signaling rising community engagement. He suggested that a breakout above the $153.65 resistance could send SOL to $180 in the near term.
$SOL is nearing key resistance at $153.65
MACD looks strong and Social Volume is rising too
A breakout could send it toward $180 imo pic.twitter.com/kDdegMegzR
— Kamil (@KamilShaheen19) April 28, 2025
Big money is quietly pouring into solana
Meanwhile, recently, three different investment firms invested a total $300 million into the Solana ecosystem, underscoring growing confidence in the ecosystem.
GSR spearheaded a $100 million private investment in UPEXI to drive a Solana-based treasury strategy, while Astra Fintech launched its own $100 million fund targeting Solana innovations. Additionally, Galaxy Digital completed a slow but deliberate $100 million swap from ETH into SOL over two weeks via Binance.
SOL Strategies also recently secured up to $500 million from ATW Partners specifically to acquire SOL tokens for staking. RockawayX, a Prague-based venture firm, announced a new $125 million fund aimed at Solana developers.
Sol price outlook
On the daily SOL price chart , the RSI sits around 63 with an upward gradient, signaling bullish momentum. This leaves room for further gains before exhaustion kicks in.
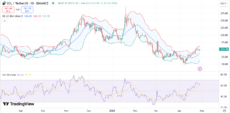
SOL price chart | Source: TradingView
Bollinger Bands are tightening slightly after expansion, suggesting that traders could see a breakout move ahead. Price action is testing the upper band, indicating strong buying pressure.
If SOL fails to hold this level, it could retrace toward the $135-$140 support zone before attempting another breakout.
Meanwhile, the MACD is also flashing bullish signals, with the MACD line trending above the signal line and positive histogram bars building up.
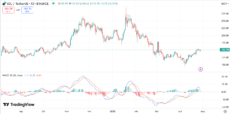
SOL price chart | Source: TradingView
Traders could notice a potential ascending triangle forming, with higher lows converging toward the $153-$154 resistance. A breakout above this level could unleash a rally toward the psychological $200 level.
nextDisclaimer: Coinspeaker is committed to providing unbiased and transparent reporting. This article aims to deliver accurate and timely information but should not be taken as financial or investment advice. Since market conditions can change rapidly, we encourage you to verify information on your own and consult with a professional before making any decisions based on this content.

