

Bitcoin (BTC/USD) is currently trading just below $95,000 after staging a steady recovery from its April lows. The world’s leading cryptocurrency has entered May 2025 with strong momentum, reclaiming key moving averages and breaking out of a prior descending trendline. However, it now finds itself in a critical resistance zone—teetering on the edge of a potential breakout or consolidation phase.
Weekly Chart: Holding Above Key Fibonacci Levels
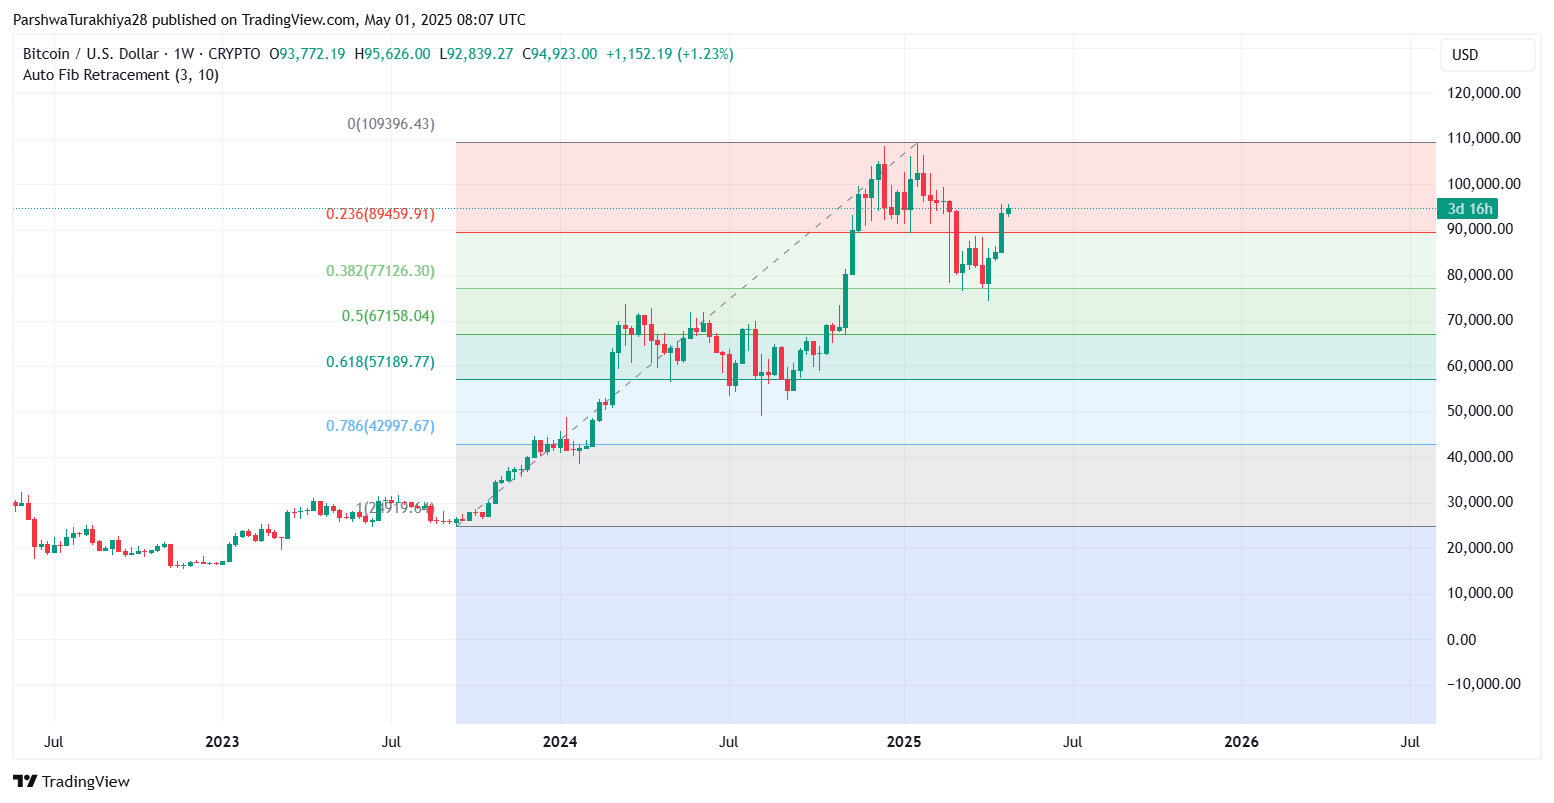
The long-term structure remains bullish. Bitcoin is holding above the 0.236 Fibonacci retracement level from its $42,997 low to its $109,396 peak, with that retracement level anchored at $89,459. As long as price action remains above this zone, bulls retain structural control.
- 0.382 Fib support sits at $77,126, which marks the next significant support in case of a pullback.
- Resistance remains heavy around $100,000–$109,000, where previous rallies faced selling pressure.
The broader structure shows a healthy retracement, followed by a reattempt at higher highs. However, BTC must breach $96K convincingly to challenge psychological and technical resistance near six figures.
Daily Chart: Breakout Retest Underway
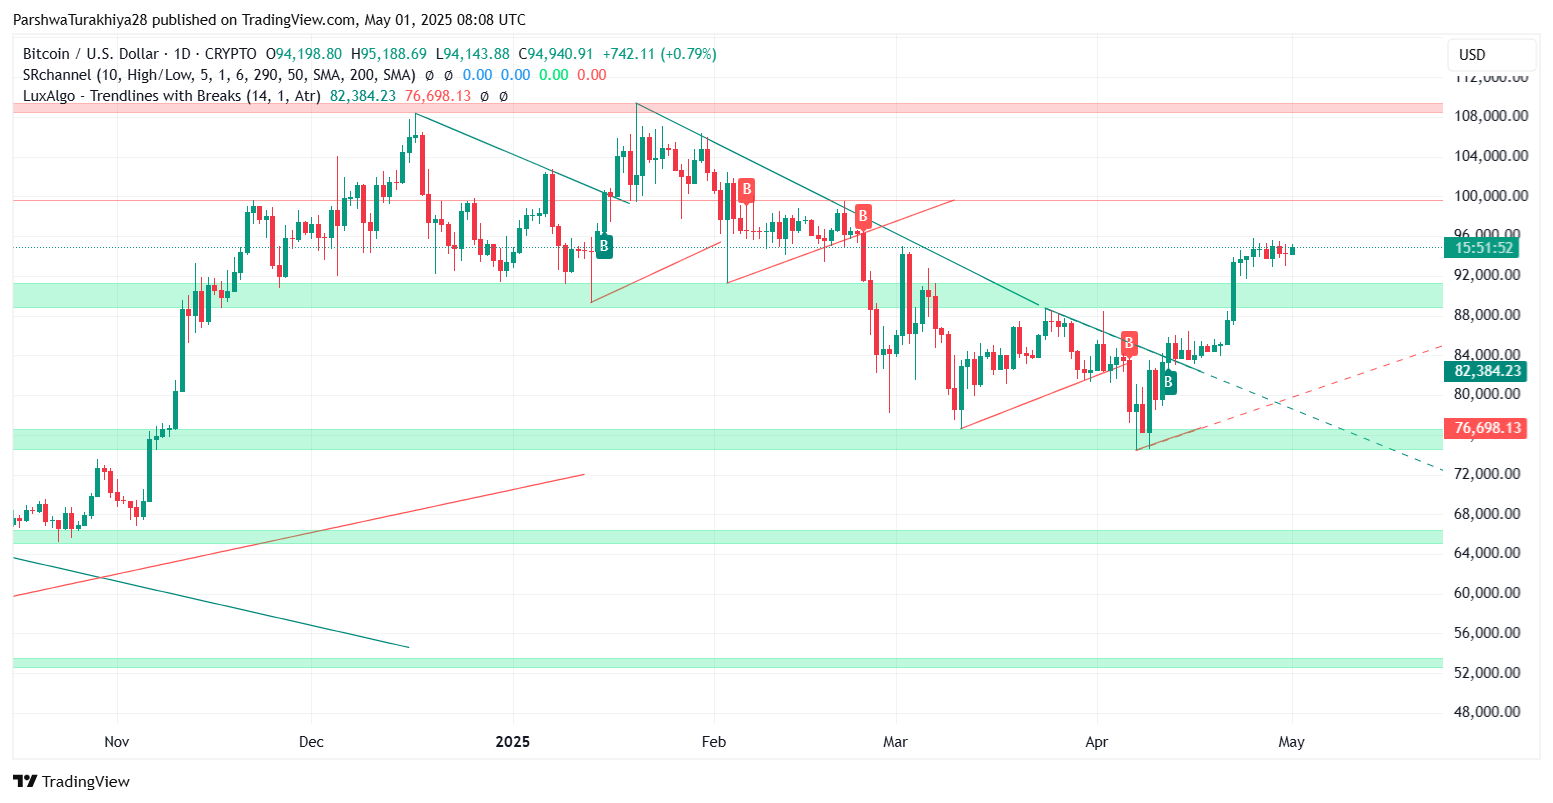
Bitcoin has recently broken above a descending trendline (visible since March) and has been consolidating around the $94K–$95K region for several days. This is the same zone where it faced rejection in early April.
- Immediate resistance: $95,600 (upper Bollinger Band and recent local top)
- Support zone: $91,000–$92,000
- Trendline retest: Completed successfully at around $88,000 in late April
Bulls must now defend the $93,000–$94,000 region and push through the $96,000 ceiling. If rejected again, BTC could range between $88K and $95K for much of May.
4-Hour Chart: Consolidation Tightens, Momentum Cooling
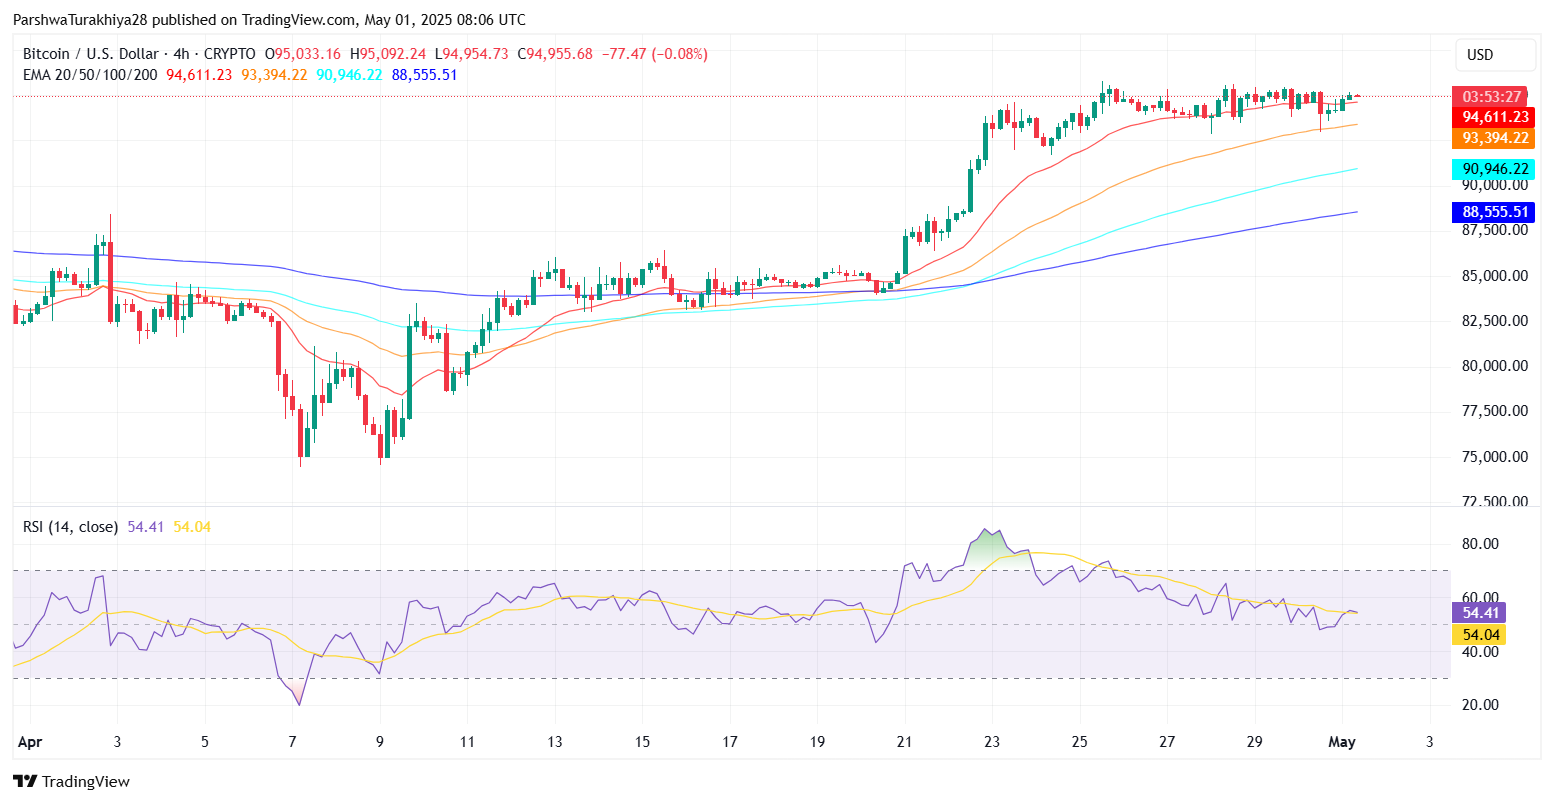
Bitcoin’s 4-hour chart reveals a clear consolidation phase between $93,000 and $95,600, forming a compression zone just beneath key resistance. The price has been repeatedly testing the upper bound of this range, yet volume remains lackluster—raising the probability of a volatility-driven breakout in early May.
The MACD shows a cooling trend after a prior bullish wave, with the histogram nearly flat, signaling indecision among market participants. Meanwhile, RSI at 54.41 reflects neutral momentum—neither favoring bulls nor bears decisively. The flattening of both indicators is consistent with the current sideways structure.
Importantly, BTC is maintaining its stance above all major EMAs on this timeframe, with the 20 EMA at $94,611 and 50 EMA at $93,394 acting as dynamic support. This alignment underlines the fact that despite the slow pace, buyers have not exited the market.
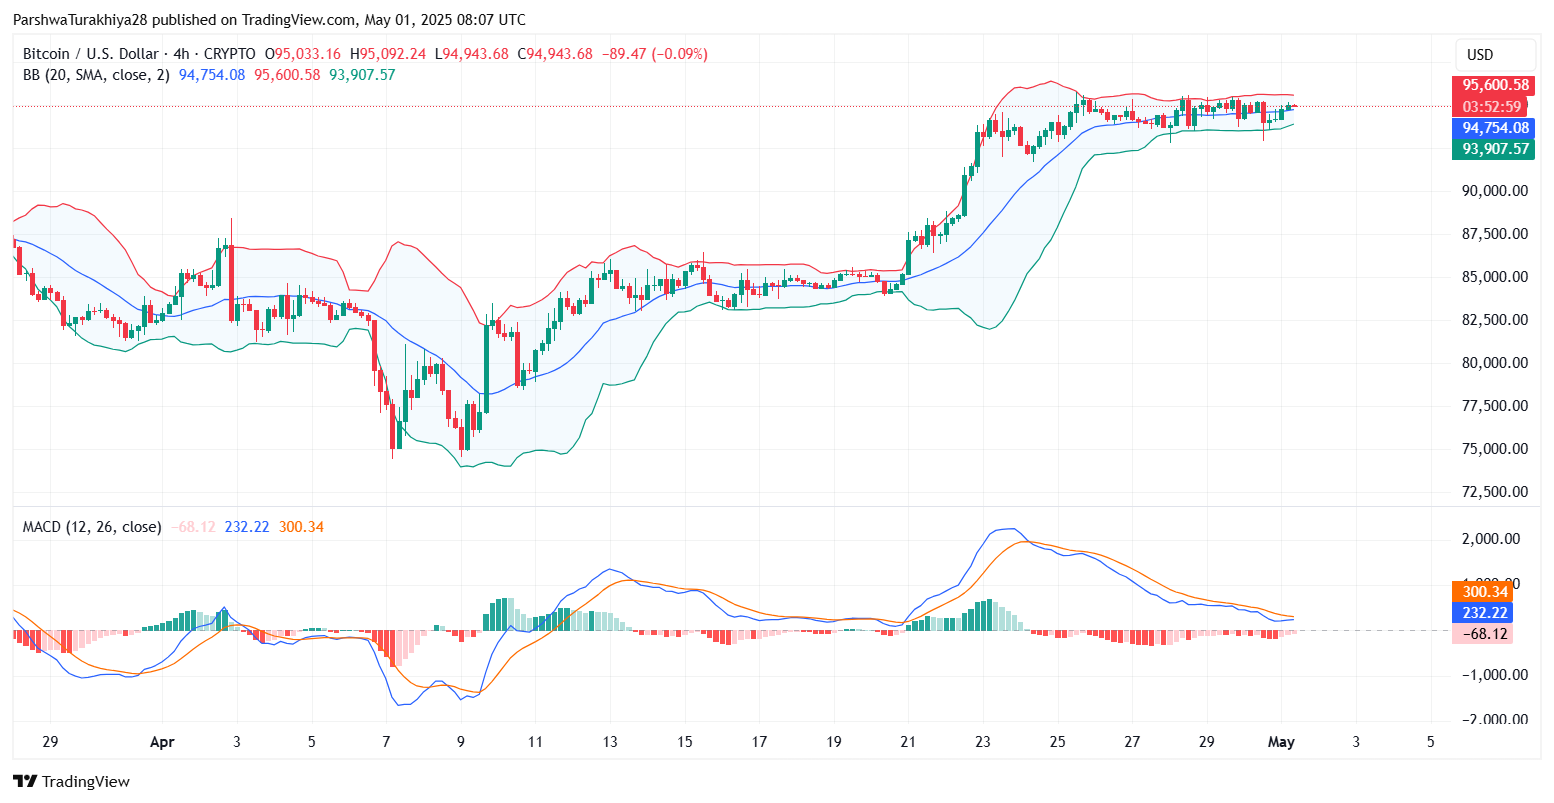
While the Bollinger Bands are contracting—indicating a squeeze—price action near the upper band favors a bullish breakout. However, without volume and a clean close above $95,600, the risk of a fakeout or range continuation remains high. Traders should wait for confirmation before taking directional positions.
Bitcoin (BTC) Price Prediction: What to Expect from Bitcoin in May 2025?
Bitcoin is currently sitting in a zone of opportunity. If it can hold above the $93K–$94K range and break through the $95.6K ceiling, the next upside targets include:
- $98,000 – short-term measured breakout target
- $100,000–$109,000 – psychological and previous all-time high zone
Conversely, if Bitcoin faces rejection and breaks below $93,000, the downside could extend toward:
- $90,000 – short-term EMA cluster support
- $88,000 – prior breakout zone
- $84,000–$82,000 – demand zone based on historical consolidation
Bitcoin Price Forecast Table: May 2025
| Price Scenario | Min Price | Avg Price | Max Price |
| Bullish breakout | $94,000 | $98,000 | $105,000 |
| Bearish breakdown | $82,000 | $88,000 | $93,000 |
| Range-bound trend | $88,000 | $94,000 | $95,600 |
Bitcoin enters May 2025 with a strong technical foundation but now faces the crucial test of breaking through its multi-week resistance zone. The consolidation beneath $96K may act as a springboard for a breakout—or it could lead to exhaustion if bulls fail to sustain momentum. Traders should monitor volume, EMA confluence, and Bollinger Band expansion closely to position accordingly.
Disclaimer: The information presented in this article is for informational and educational purposes only. The article does not constitute financial advice or advice of any kind. Coin Edition is not responsible for any losses incurred as a result of the utilization of content, products, or services mentioned. Readers are advised to exercise caution before taking any action related to the company.

