
XRP Gains Momentum as ETF Approval Odds Hit 85%

XRP gains ground amid rising ETF optimism and improving RSI, but a breakout above $2.30 is critical for confirming the next bullish move.
XRP is up 4% in the last 24 hours, gaining momentum as investor optimism grows around the rising odds of a US XRP Spot ETF approval. This boost in sentiment comes alongside improving technical signals, with the RSI recovering to neutral territory and price action holding just above the Ichimoku Cloud.
While XRP remains range-bound, its bullish EMA structure and support stability suggest the market is cautiously optimistic. The coming days may prove pivotal, as a breakout above resistance could align with the growing ETF narrative to drive further upside.
XRP RSI Rebounds to Neutral Zone: Is Momentum Shifting?
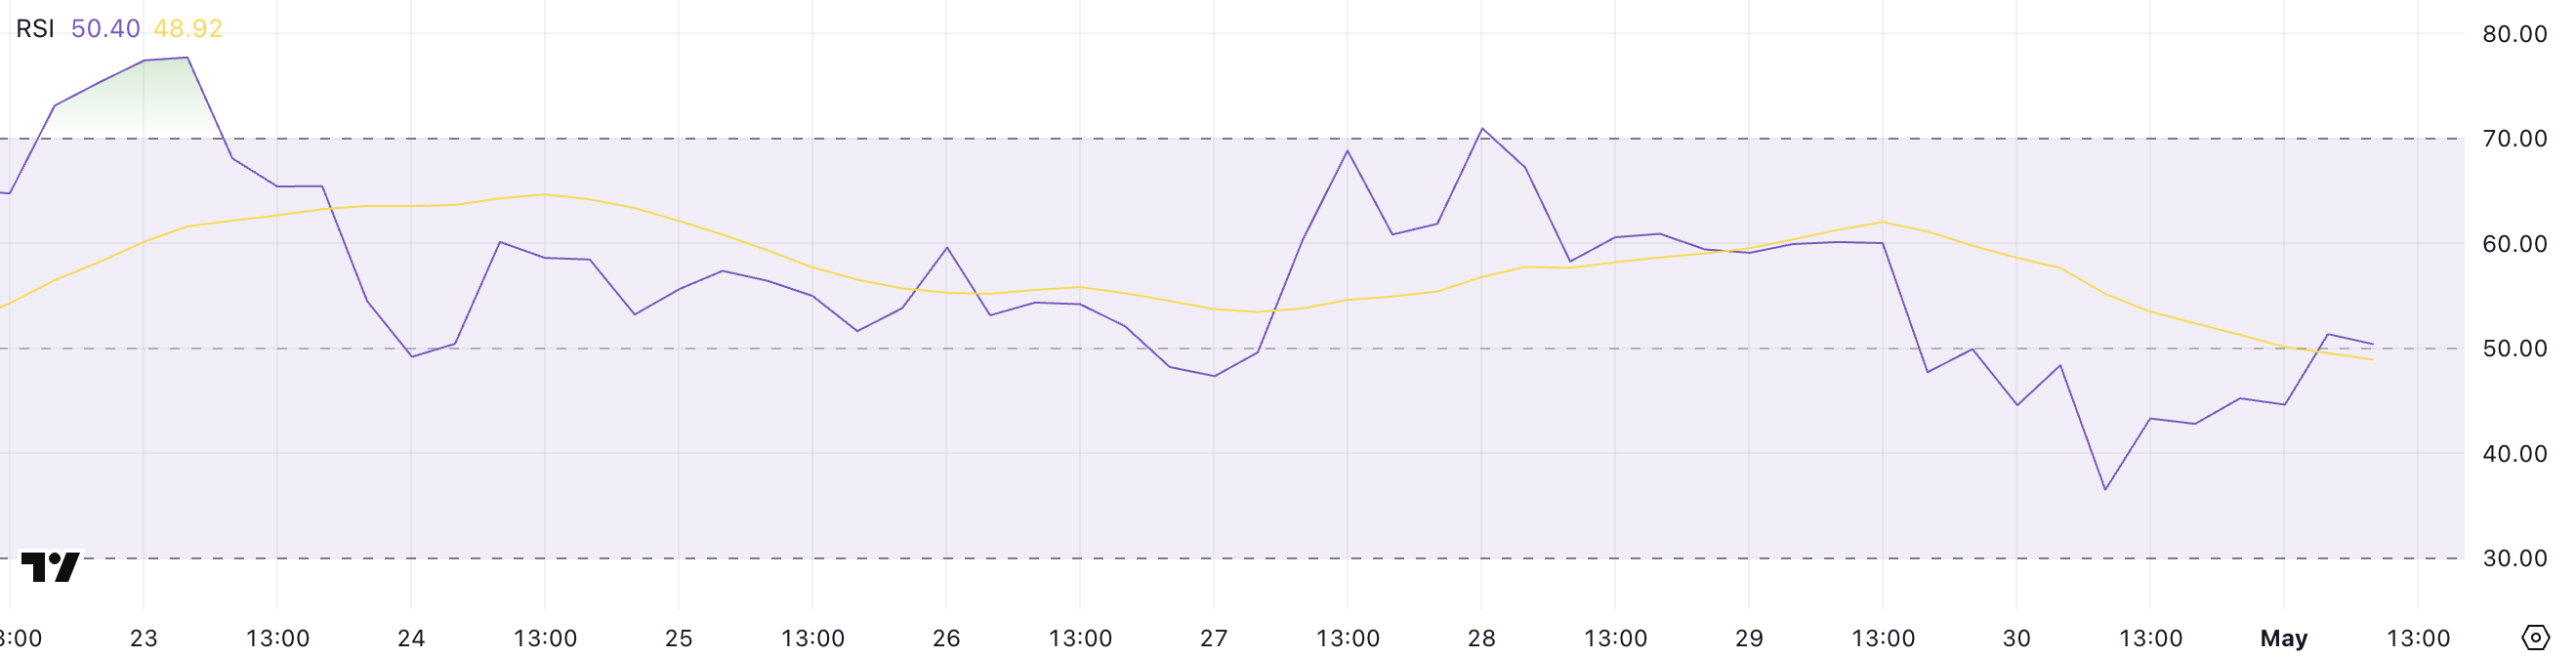
XRP’s Relative Strength Index (RSI) has rebounded significantly, climbing from 36.51 yesterday to 50.40 today, after previously reaching an overbought peak of 70.95 on April 28.
This shift reflects a cooling off in selling pressure following a sharp dip, placing XRP in a more neutral technical zone.
While the RSI hasn’t fully recovered to bullish territory, the move back above 50 often signals a potential shift in momentum, especially if it continues trending higher in the coming sessions.
 XRP RSI. Source:
TradingView.
XRP RSI. Source:
TradingView.
The RSI is a momentum oscillator that measures the speed and change of price movements on a scale of 0 to 100. Readings above 70 typically indicate that an asset is overbought and may be due for a correction, while readings below 30 suggest oversold conditions and potential for a rebound.
With XRP’s RSI now at 50.40, the asset is neither overheated nor undervalued, suggesting market indecision.
However, maintaining this level or pushing higher could support a short-term bullish case, particularly if paired with strong volume or a breakout above nearby resistance.
XRP Struggles for Direction
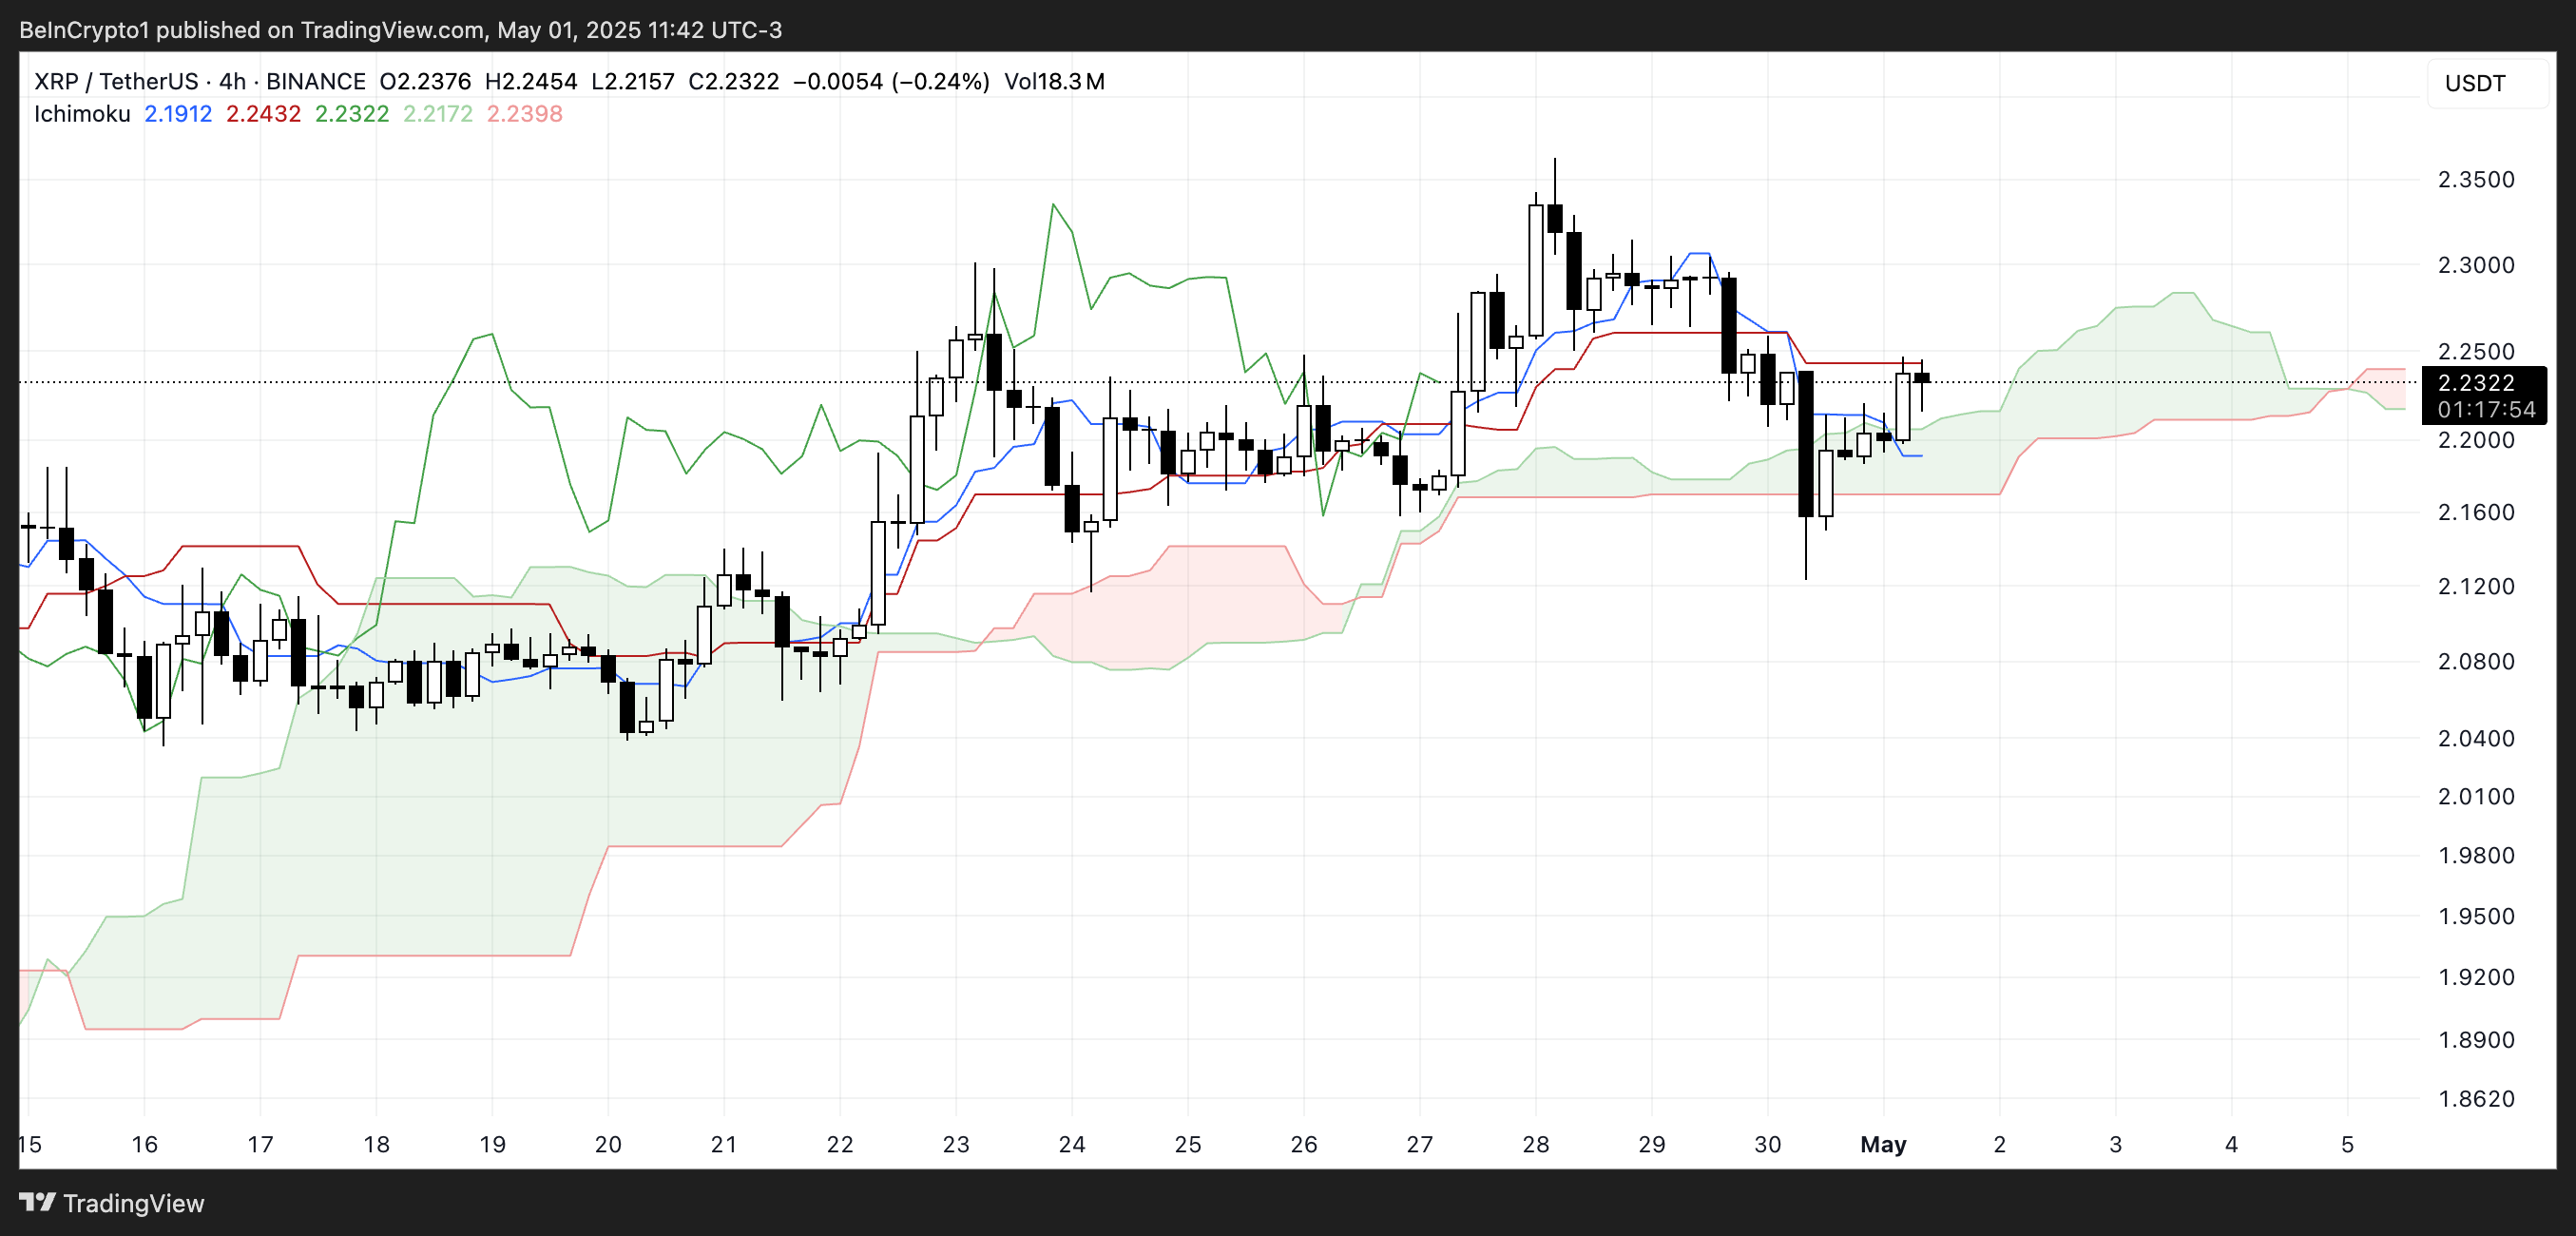
The Ichimoku Cloud chart shows XRP trading just above the cloud. This zone often acts as dynamic support in bullish setups.
The current position suggests weak bullish momentum. However, the cloud ahead has turned from green to red. This shift signals potential resistance and a weakening trend outlook.
The Tenkan-sen (blue line) and Kijun-sen (red line) are close together and mostly flat. This reflects short-term uncertainty, even as the price stays slightly elevated.
 XRP Ichimoku Cloud. Source:
TradingView.
XRP Ichimoku Cloud. Source:
TradingView.
The Chikou Span (green lagging line) is still hovering near past price action, offering no strong confirmation of bullish continuation.
The shift to a red cloud ahead introduces caution, as it may represent an upcoming battle between bulls trying to hold above support and bears eyeing a reversal.
A decisive move away from the cloud—either upward or back into it—will likely determine XRP’s next trend direction.
XRP Holds Bullish EMA Structure But Faces Key Price Levels
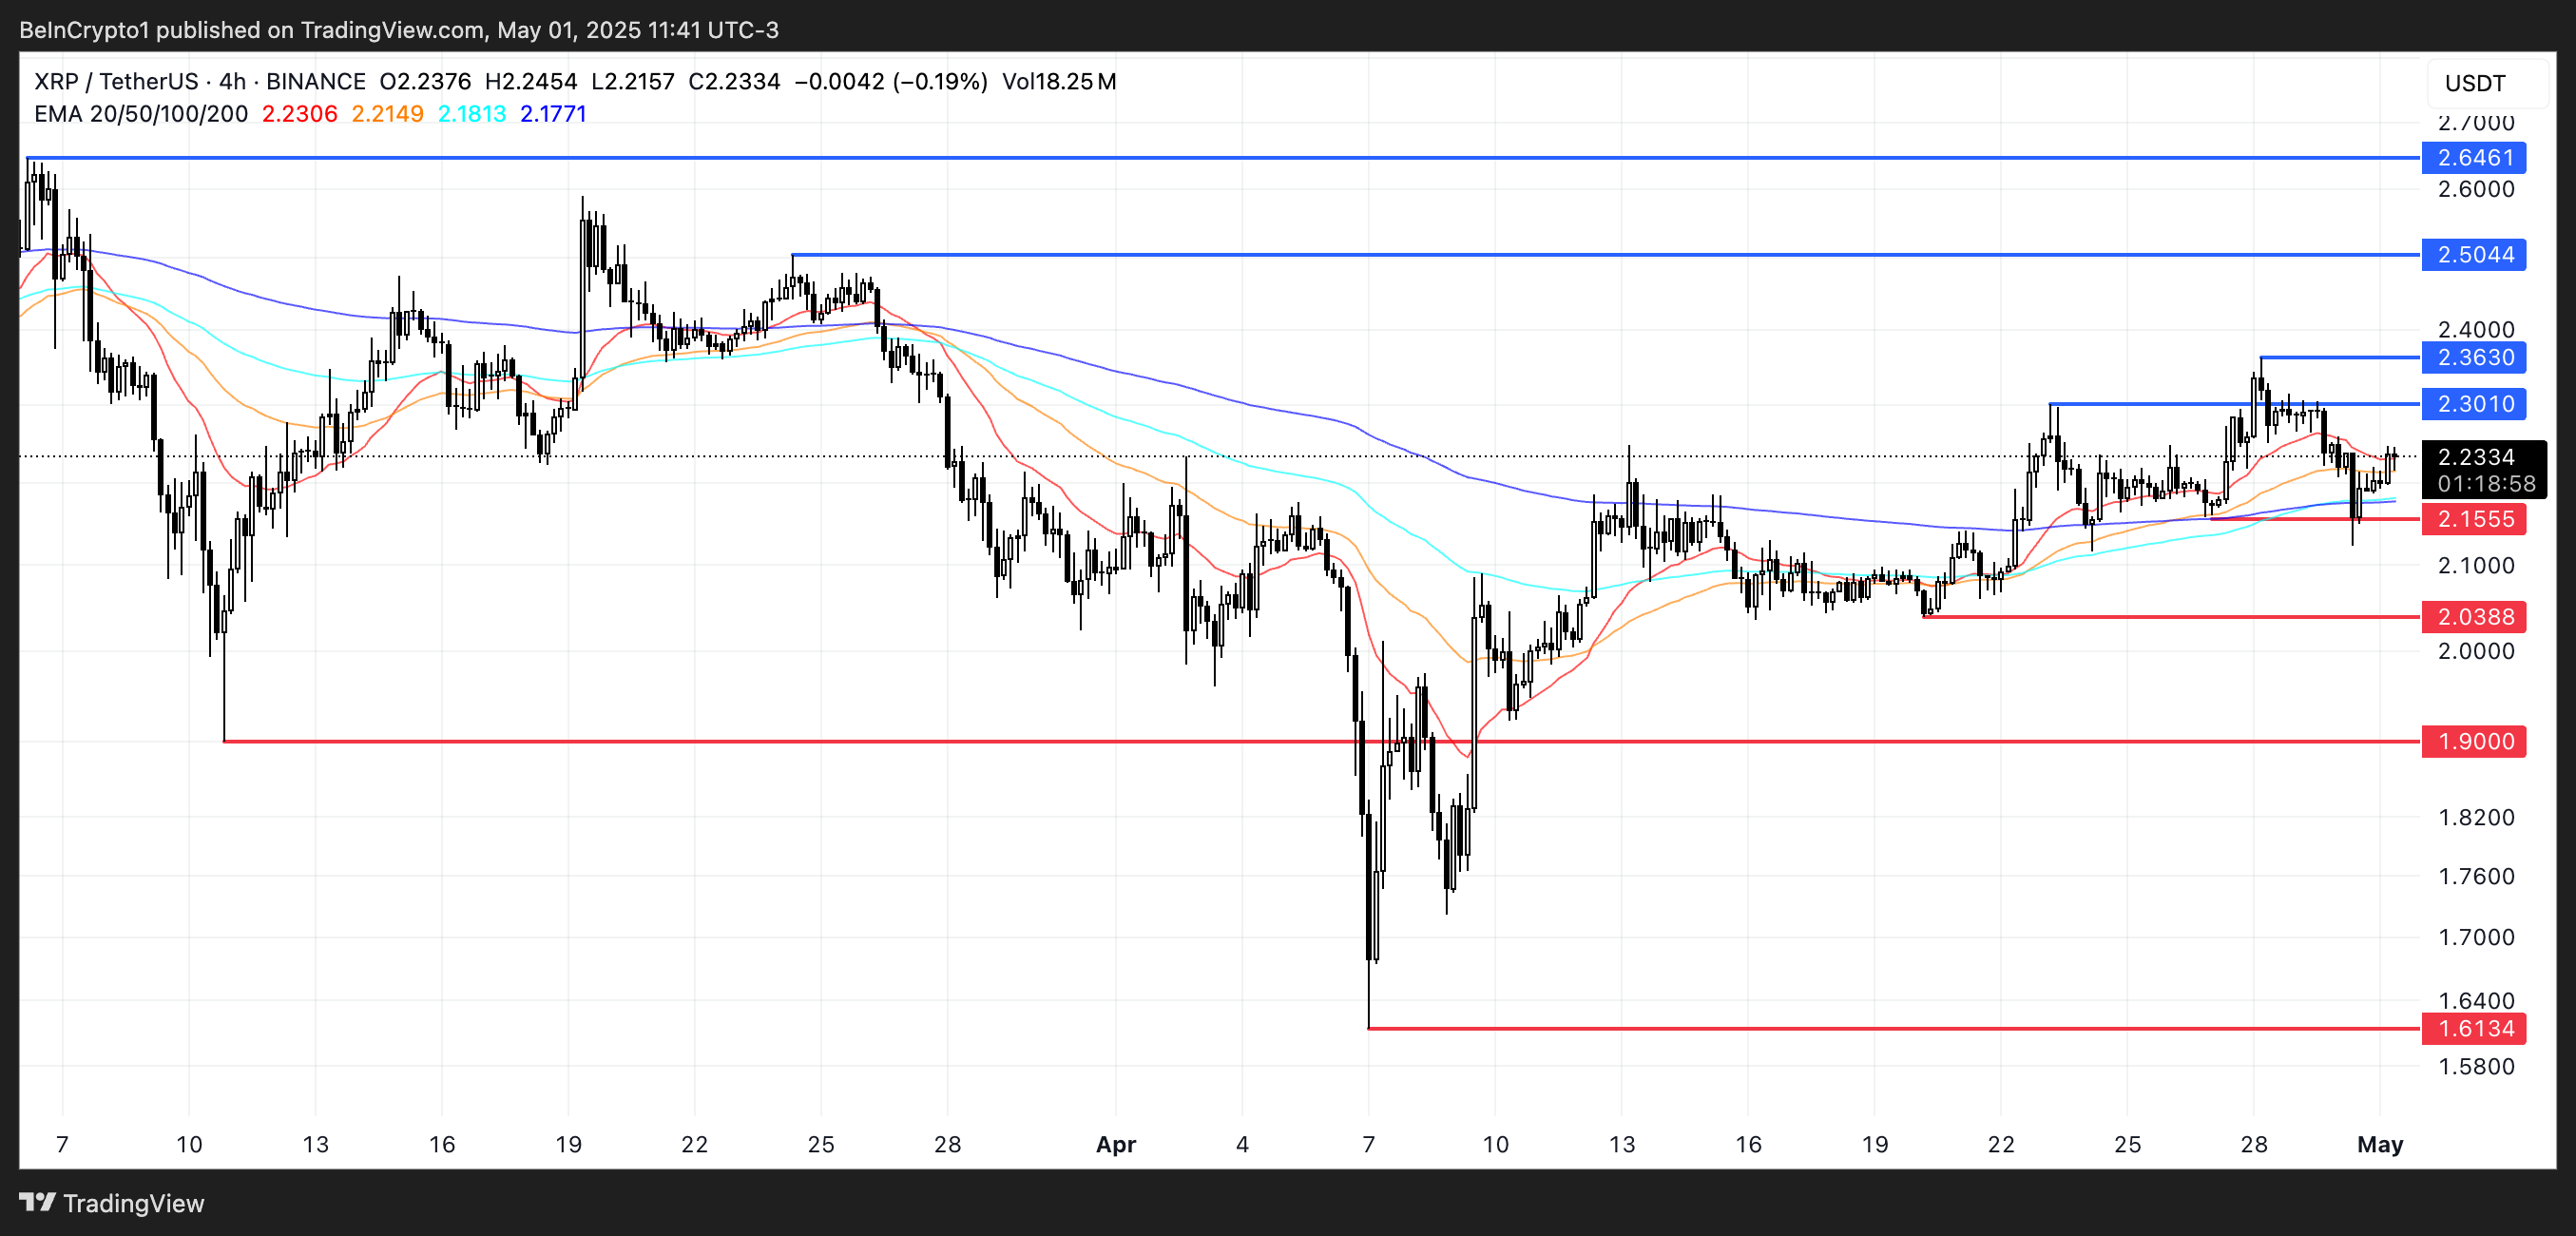
XRP’s Exponential Moving Averages (EMAs) remain bullish. Shorter-term lines are still above the longer-term ones, signaling upward momentum. This comes as XRP spot ETF approval odds rise to 85% for 2025.
However, price action is stuck between a $2.30 resistance and a $2.15 support. It’s a tight range where either side could take control.
If the $2.15 support is tested again and breaks, XRP could fall toward $2.03 and possibly $1.90. That would put the bullish structure under pressure.
 XRP Price Analysis. Source:
TradingView.
XRP Price Analysis. Source:
TradingView.
Conversely, a successful breakout above the $2.30 resistance could trigger a new leg upward, especially if followed by a move past $2.36.
In that case, XRP price would likely target $2.50 and potentially $2.64 as the next resistance zones.
As long as the EMAs maintain their current structure, bulls retain the technical edge. However, a decisive move beyond the current range is needed to confirm the next directional trend.
Disclaimer: The content of this article solely reflects the author's opinion and does not represent the platform in any capacity. This article is not intended to serve as a reference for making investment decisions.
You may also like
New spot margin trading pair — HOLO/USDT!
FUN drops by 32.34% within 24 hours as it faces a steep short-term downturn
- FUN plunged 32.34% in 24 hours to $0.008938, marking a 541.8% monthly loss amid prolonged bearish trends. - Technical breakdowns, elevated selling pressure, and forced liquidations highlight deteriorating market sentiment and risk-off behavior. - Analysts identify key support below $0.0080 as critical, with bearish momentum confirmed by RSI (<30) and MACD indicators. - A trend-following backtest strategy proposes short positions based on technical signals to capitalize on extended downward trajectories.

OPEN has dropped by 189.51% within 24 hours during a significant market pullback
- OPEN's price plummeted 189.51% in 24 hours to $0.8907, marking its largest intraday decline in history. - The token fell 3793.63% over 7 days, matching identical monthly and yearly declines, signaling severe bearish momentum. - Technical analysts cite broken support levels and lack of bullish catalysts as key drivers of the sustained sell-off. - Absence of stabilizing volume or reversal patterns leaves the market vulnerable to further downward pressure.

New spot margin trading pair — LINEA/USDT!