

Date: Fri, May 02, 2025 | 05:10 AM GMT
After a rough start to 2025, where even Ethereum (ETH) tanked by 45% in Q1, the crypto market is finally flashing signs of life over the past month, and this bullish momentum is now spilling over into major altcoins .
Among them, XRP is quietly setting up for what could be its next short upside move.
After experiencing a significant sell-off in Q1, XRP has surged by 6% over the past 30 days — and now, a familiar fractal pattern is emerging, hinting that the recovery may not be over just yet.
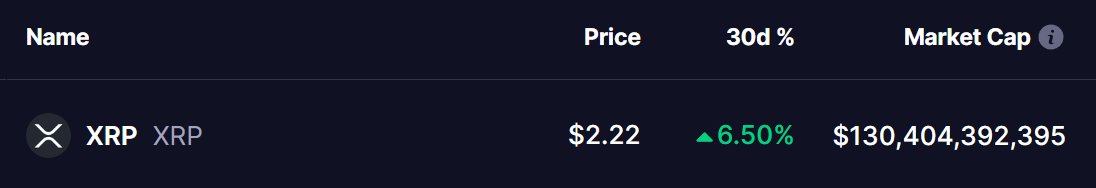 Source: Coinmarketcap
Fractal Pattern Suggests XRP Is Following HYPE’s Footsteps
Take a look at the side-by-side chart comparison of HYPE and XRP.
On the left, HYPE underwent a sharp -56% correction, which formed a classic bearish cypher harmonic pattern — a technical structure often associated with sharp reversals. After bottoming out near $9.34 on April 7th, HYPE staged a remarkable recovery, reclaiming both the 50-day and 100-day moving averages. That technical breakout led to a 53% rally, propelling HYPE to over $20, now brushing up against a strong resistance zone around $21.12.
Now, flip your eyes to the right side — XRP’s chart looks eerily similar.
XRP suffered a -38% decline, hit a low around $1.61 on April 6th, and has since bounced, now trading near $2.23. Like HYPE, XRP has reclaimed its 50-day moving average and is approaching the 100-day MA at $2.38 — a level that marked the breakout point for HYPE.
What’s Next for XRP?
If XRP continues to mirror the fractal from HYPE, the next key level to watch is the 100-day MA at $2.38. A clean breakout above that could open the door toward the major resistance zone near $2.64, representing a potential 19% upside from current levels.
With broader market sentiment improving and XRP tracking an almost identical price structure as HYPE did weeks ago, the stage may be set for a bullish breakout in the days ahead.
Disclaimer: This article is for informational purposes only and does not constitute financial advice. Always conduct your own research and consult a financial advisor before making any investment decisions.