
Analyst Identifies When Bitcoin Price Will Reach Cycle Top — Here’s The Timeline

The Bitcoin price appeared to have reached its top in this current cycle, embarking on a downward trend after notching a new all-time high of $108,786 at the beginning of the year. The story seems to be changing again for the premier cryptocurrency, as it builds on recent bullish momentum and looks to reclaim the $100,000 level.
When Will BTC Price Reach The Cycle Top?
In a recent post on the X platform, crypto analyst Brett put forward an interesting analysis of the Bitcoin price structure and its potential trajectory in what remains of the current cycle. This evaluation looks at the price of BTC from the cycle “bottom to present” and “present to top.”
Using the previous two cycles as a foundation, Brett was able to calculate the number of days it took the Bitcoin price to travel from the bottom to the present and from the present to the top. In the chart below, the “blue” box represents the amount of time since the last bottom, while the “green” box represents the amount of time from “present” to the cycle tops.
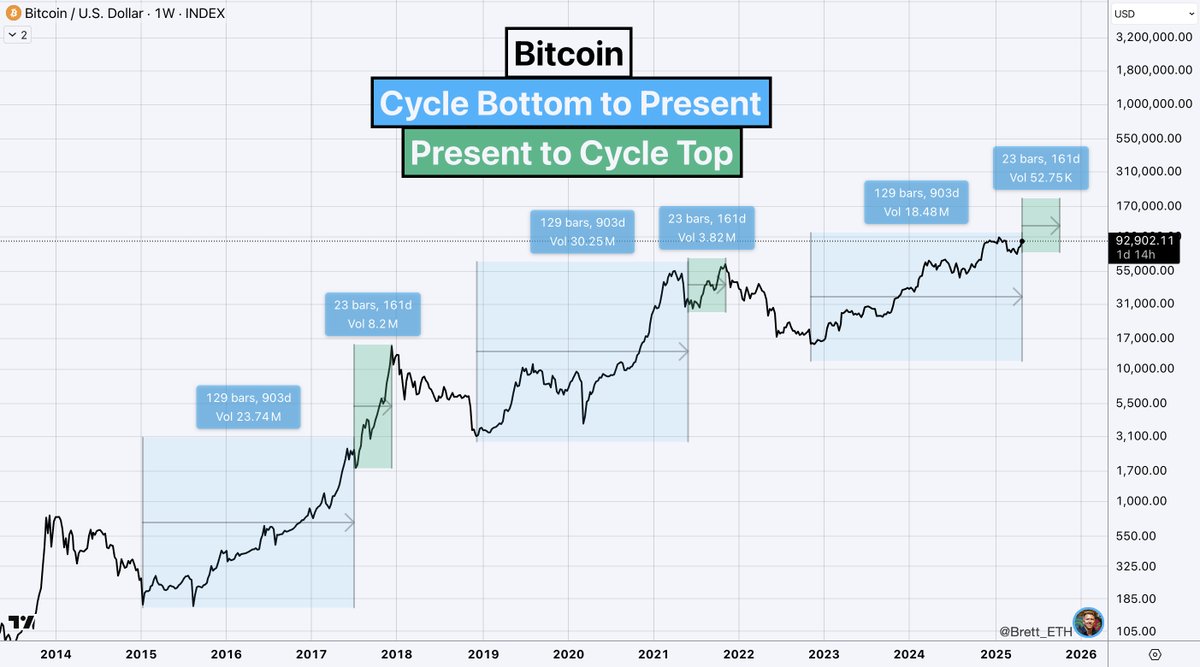
Brett noted that the amount of time between the Bitcoin price bottom in 2022 and the present day is exactly 903 days. As observed in the highlighted chart, the analyst transposed this same period on the previous two cycles (starting at the 2015 and 2018 bottoms, respectively).
In the previous two cycles, the Bitcoin price reached a new all-time high or the cycle peak 161 days after the highlighted 903-day period (after the bottom). In 2017, it took the flagship cryptocurrency 161 days to reach a then-all-time high of around $16,000. Similarly, the BTC price also reached the cycle top around $69,000 after 161 days in 2021.
From this historical perspective, this pattern suggests that the current cycle’s top for the Bitcoin price could be just 161 days away. If the pattern holds and the current price trajectory continues, this would place the premier cryptocurrency’s peak at exactly October 11, 2025.
However, it is worth mentioning that there have been questions about the Bitcoin price following the typical cycle theory. With the bull run initially pronounced over at the start of 2025, the recent positive price action in the market seems to oppose the expected cyclical price movement.
Bitcoin Price At A Glance
As of this writing, the price of BTC stands at around $96,500, reflecting an almost 1% decline in the past 24 hours.
Disclaimer: The content of this article solely reflects the author's opinion and does not represent the platform in any capacity. This article is not intended to serve as a reference for making investment decisions.
You may also like
New spot margin trading pair — HOLO/USDT!
FUN drops by 32.34% within 24 hours as it faces a steep short-term downturn
- FUN plunged 32.34% in 24 hours to $0.008938, marking a 541.8% monthly loss amid prolonged bearish trends. - Technical breakdowns, elevated selling pressure, and forced liquidations highlight deteriorating market sentiment and risk-off behavior. - Analysts identify key support below $0.0080 as critical, with bearish momentum confirmed by RSI (<30) and MACD indicators. - A trend-following backtest strategy proposes short positions based on technical signals to capitalize on extended downward trajectories.

OPEN has dropped by 189.51% within 24 hours during a significant market pullback
- OPEN's price plummeted 189.51% in 24 hours to $0.8907, marking its largest intraday decline in history. - The token fell 3793.63% over 7 days, matching identical monthly and yearly declines, signaling severe bearish momentum. - Technical analysts cite broken support levels and lack of bullish catalysts as key drivers of the sustained sell-off. - Absence of stabilizing volume or reversal patterns leaves the market vulnerable to further downward pressure.

New spot margin trading pair — LINEA/USDT!