

Date: Mon, May 05, 2025 | 07:54 AM GMT
After a rough start to 2025, where even Ethereum (ETH) tanked by 45% in Q1, the crypto market is finally flashing signs of life. ETH has rebounded by 31% since its April 9 low — and this fresh wave of bullish momentum is now spilling over into the broader market.
The question now: is this just a short-term bounce, or is Ethereum preparing for a much larger breakout?
ETH Chart Mirrors BTC’s 2020-2021 Pre-Bull Run Setup
A side-by-side comparison shared by prominent crypto analyst JACKIS shows a compelling similarity between Ethereum’s current daily chart and Bitcoin’s 2019–2020 accumulation structure just before its explosive 2021 bull run.
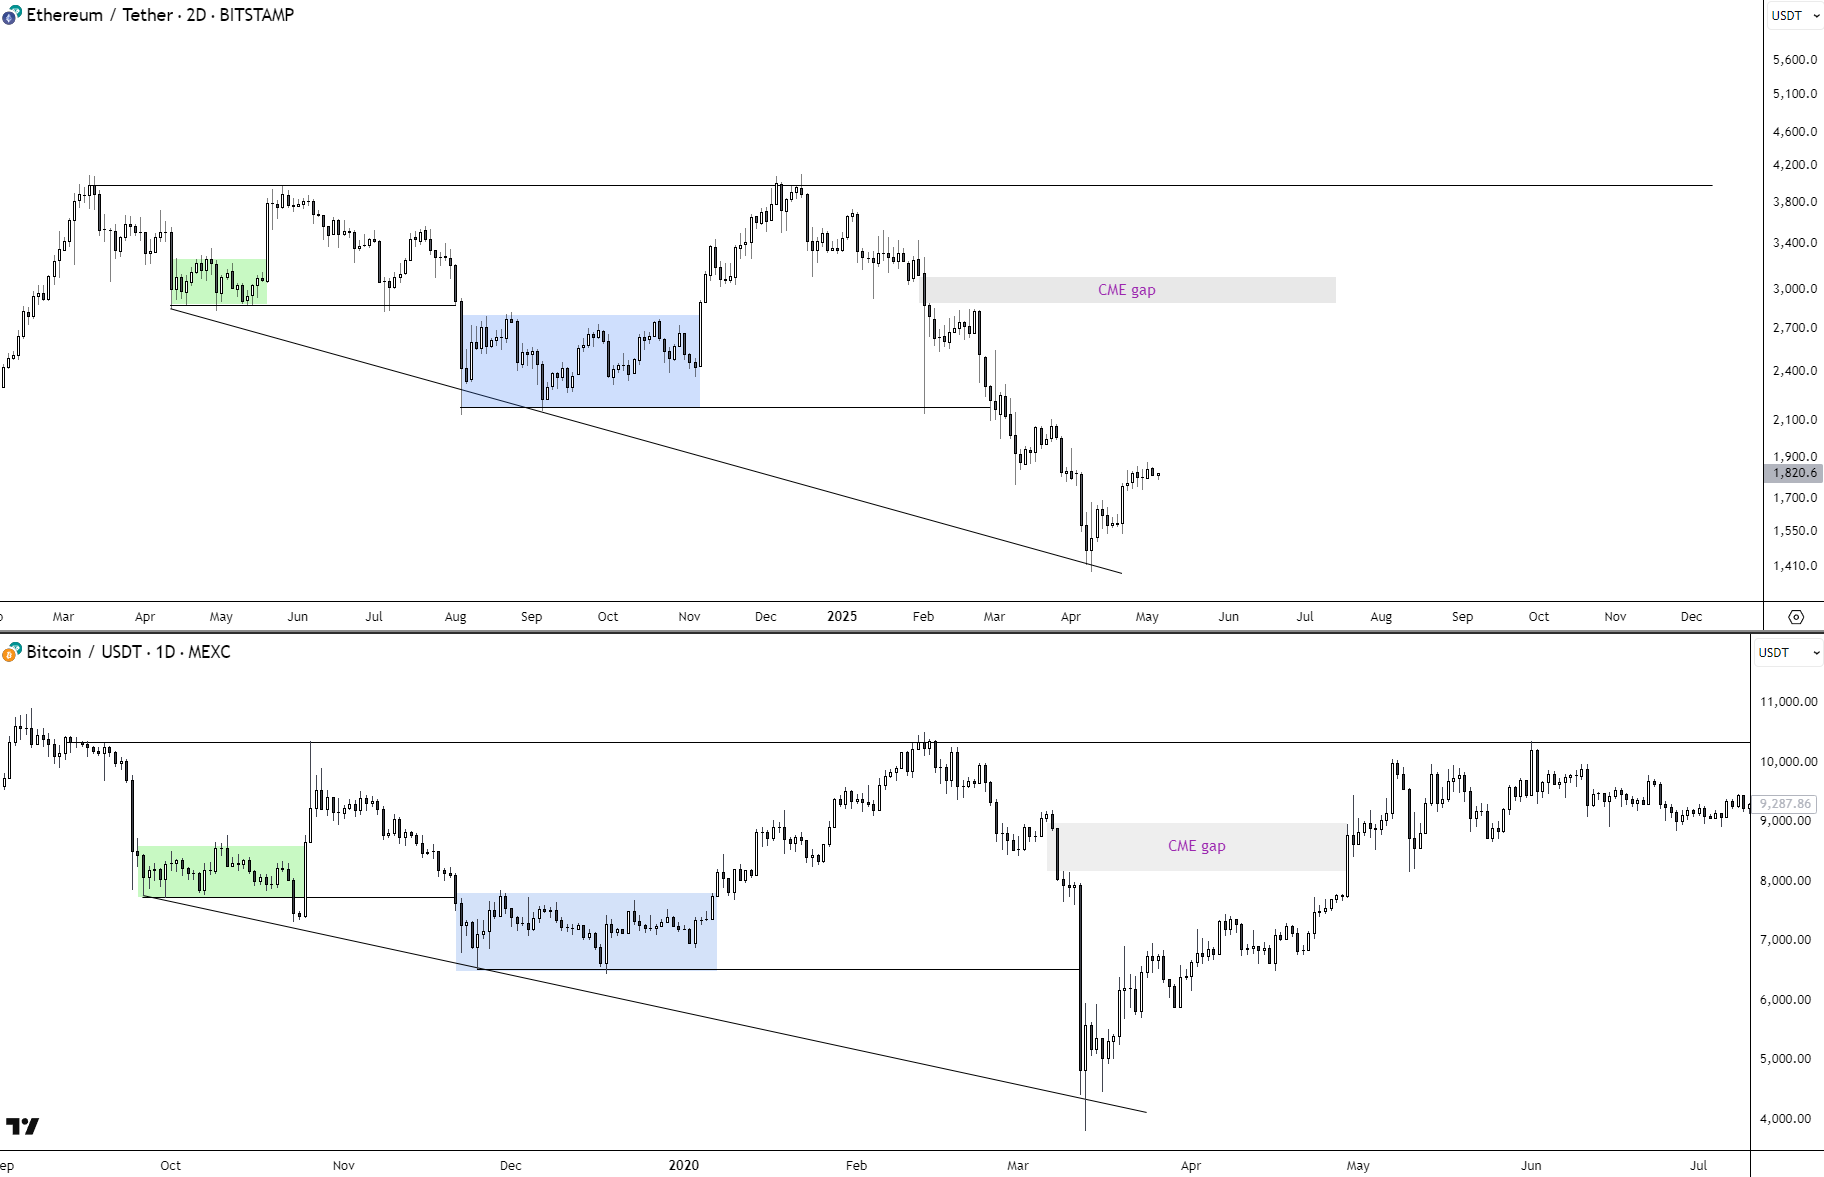 ETH-BTC Fractal Chart/Source: @i_am_jackis (X)
In both charts:
- A descending wedge structure was followed by extended sideways consolidation in a boxed range (highlighted in blue).
- Price breaks out of the wedge, retests the horizontal support line, then builds higher lows — a classic accumulation pattern before a bullish expansion.
- Notably, both ETH now and BTC back then show a CME gap in the $2,900 and $9,000 ranges respectively — acting as magnets for price.
In the past, Bitcoin’s structure led to a 6x rally, pushing prices from under $10,000 to over $60,000 in under a year. If Ethereum’s price plays out similarly, we could be in the early stages of a powerful bullish leg.
What’s Next For ETH?
Currently trading around $1,820, Ethereum is inching its way back into a critical zone. If bulls can clear the $2,000–$2,100 resistance, especially the top of the CME gap region, a move toward $4,000 and beyond could be on the table.
However, a failure to hold the breakout structure and a drop back into the wedge could delay this move — or invalidate the fractal altogether. That said, historical context paired with technical structure suggests ETH may be at the start of something big, not the end of a bounce.
Disclaimer: This article is for informational purposes only and not financial advice. Always conduct your own research before investing in cryptocurrencies.

