
Pi Token Stuck in Tight Range as Traders Await Breakout Catalyst

Pi Network's (PI) price has stalled in a narrow range, with technical indicators pointing to indecision and low volatility, as traders await a breakout catalyst.
Since April 9, the Pi token has traded within a tight consolidation range, facing resistance at $0.66 and consistently finding support around $0.57.
The token made one failed attempt to break out of this channel on April 12, but upon retest, the momentum has since stalled.
PI Traders Wait on the Sidelines
An assessment of some technical indicators on the daily chart reveals a pattern of indecision among PI holders. For example, the token’s Relative Strength Index (RSI) has trended flatly since the beginning of May, seeing no major spikes or declines.
This highlights the relative balance between buying and selling pressures in the market. At press time, the momentum indicator sits at 40.49.
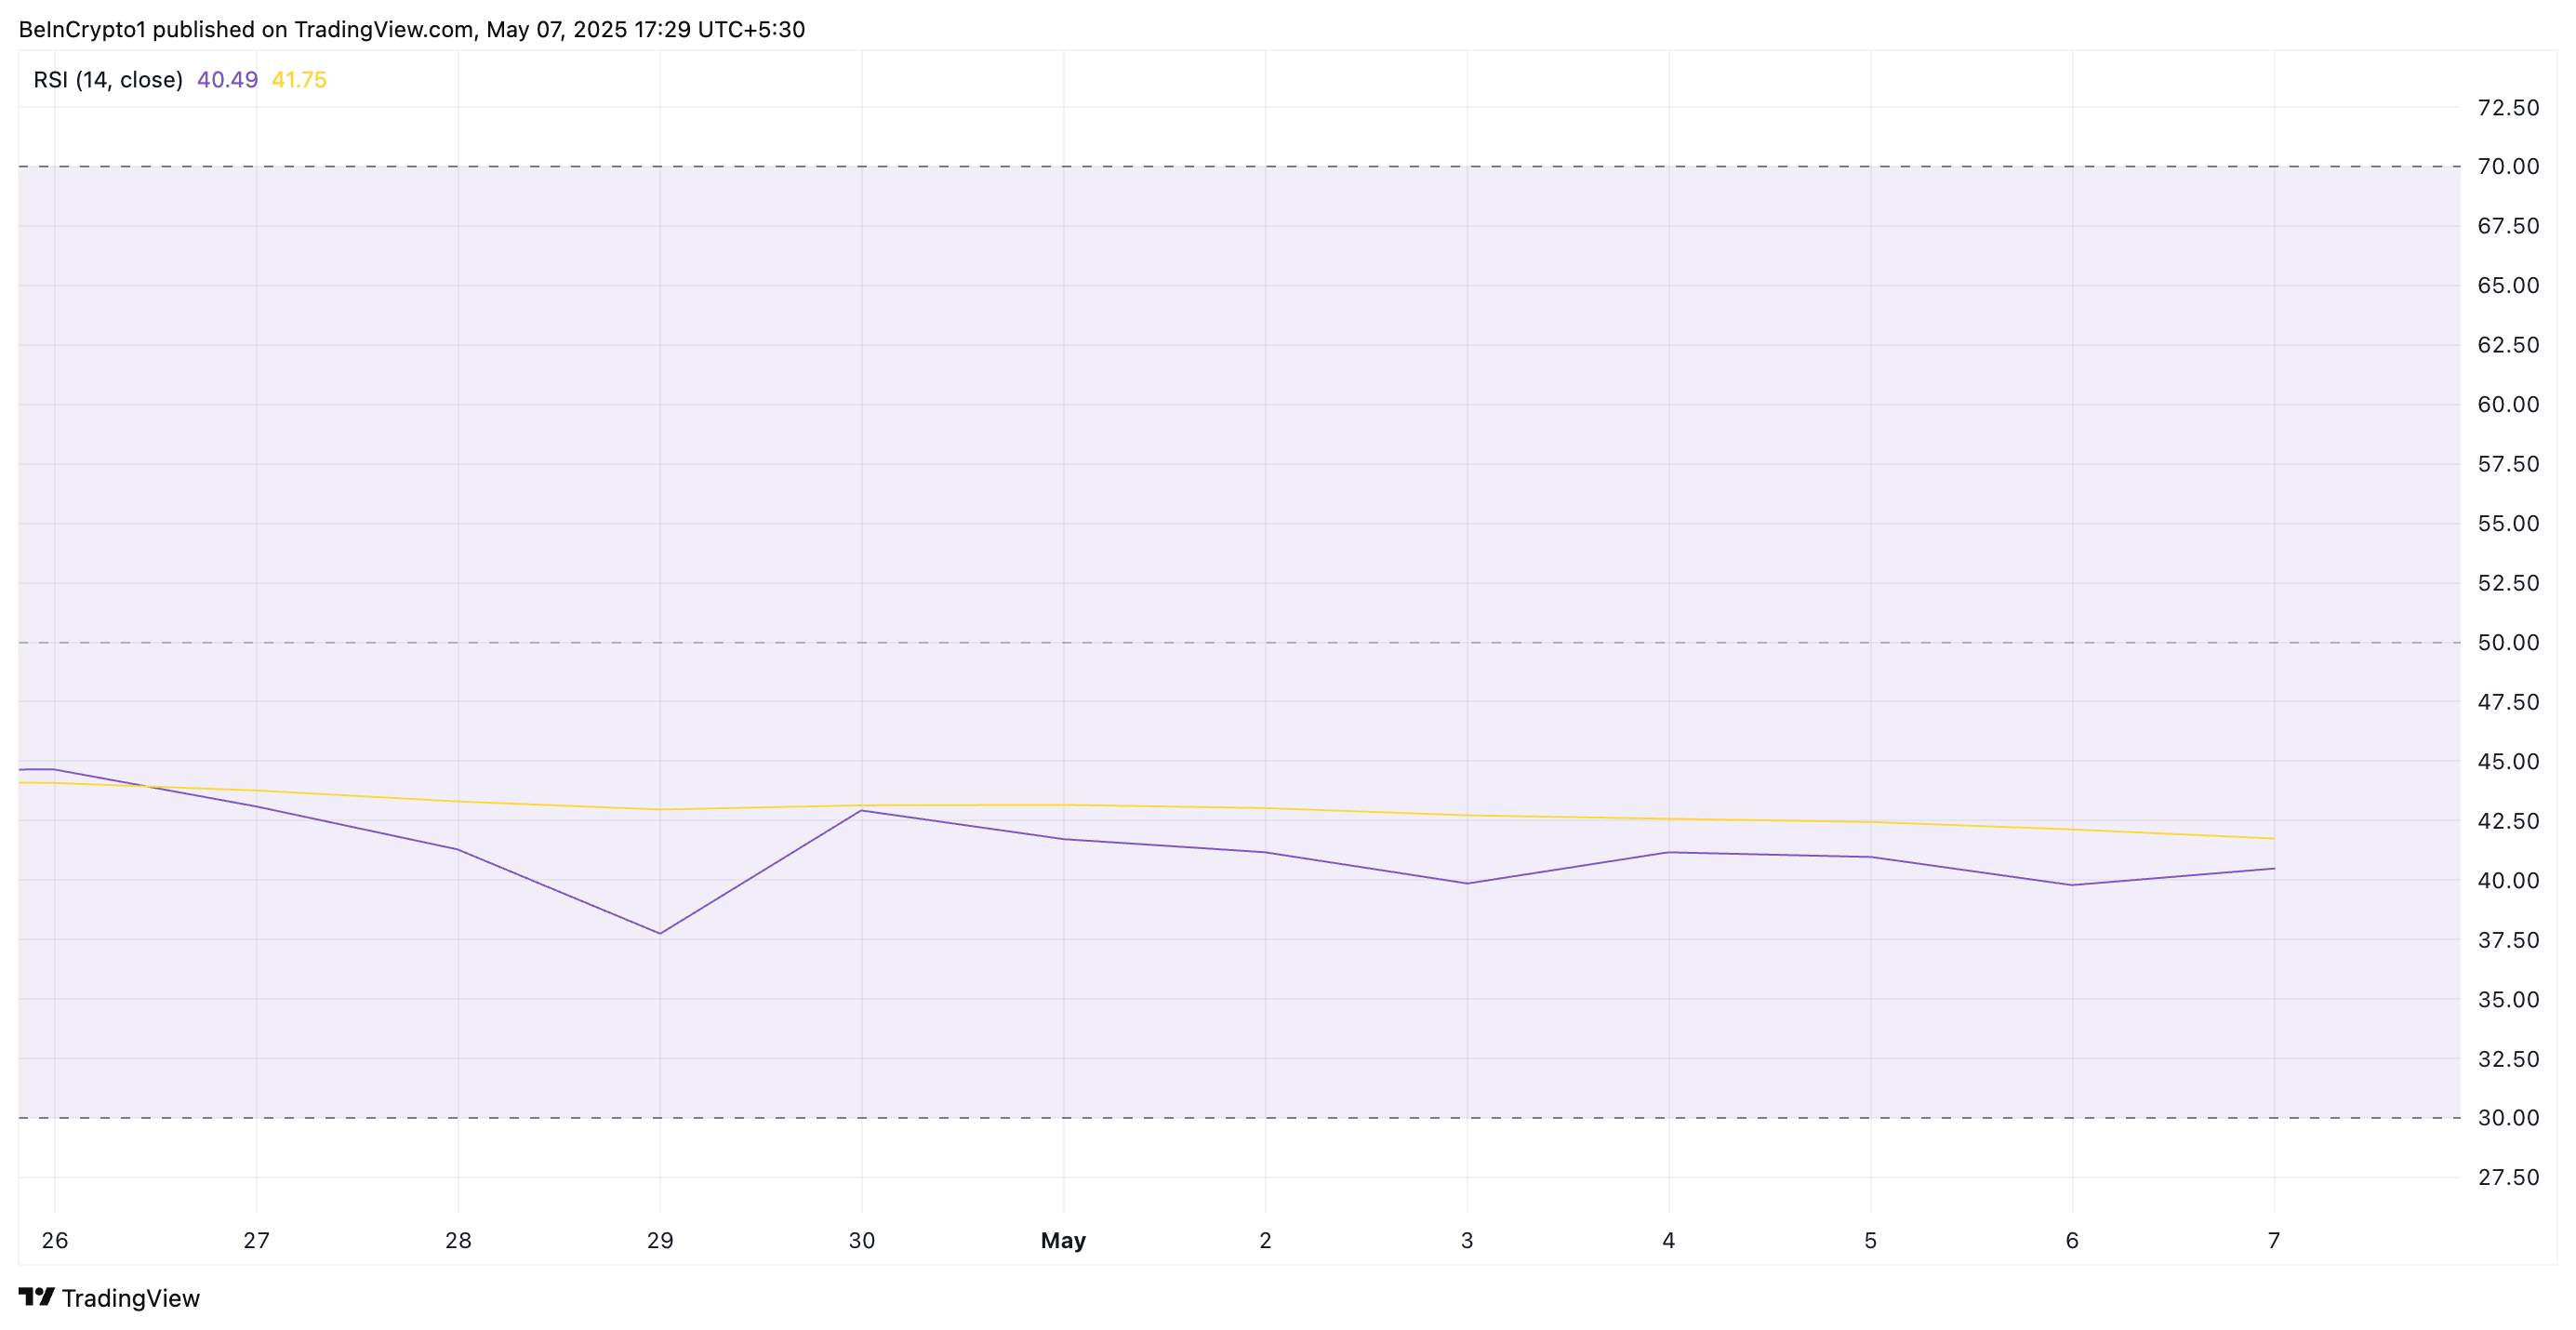 PI RSI. Source:
TradingView
PI RSI. Source:
TradingView
A flat RSI over an extended period indicates the market lacks strong conviction in either direction. This pattern signals that PI traders are hesitant to commit to significant buy or sell positions and await a catalyst or trend confirmation.
Similarly, PI’s Average True Range (ATR) has been on the decline, reflecting a steady drop in market volatility. At press time, this sits at 0.051.
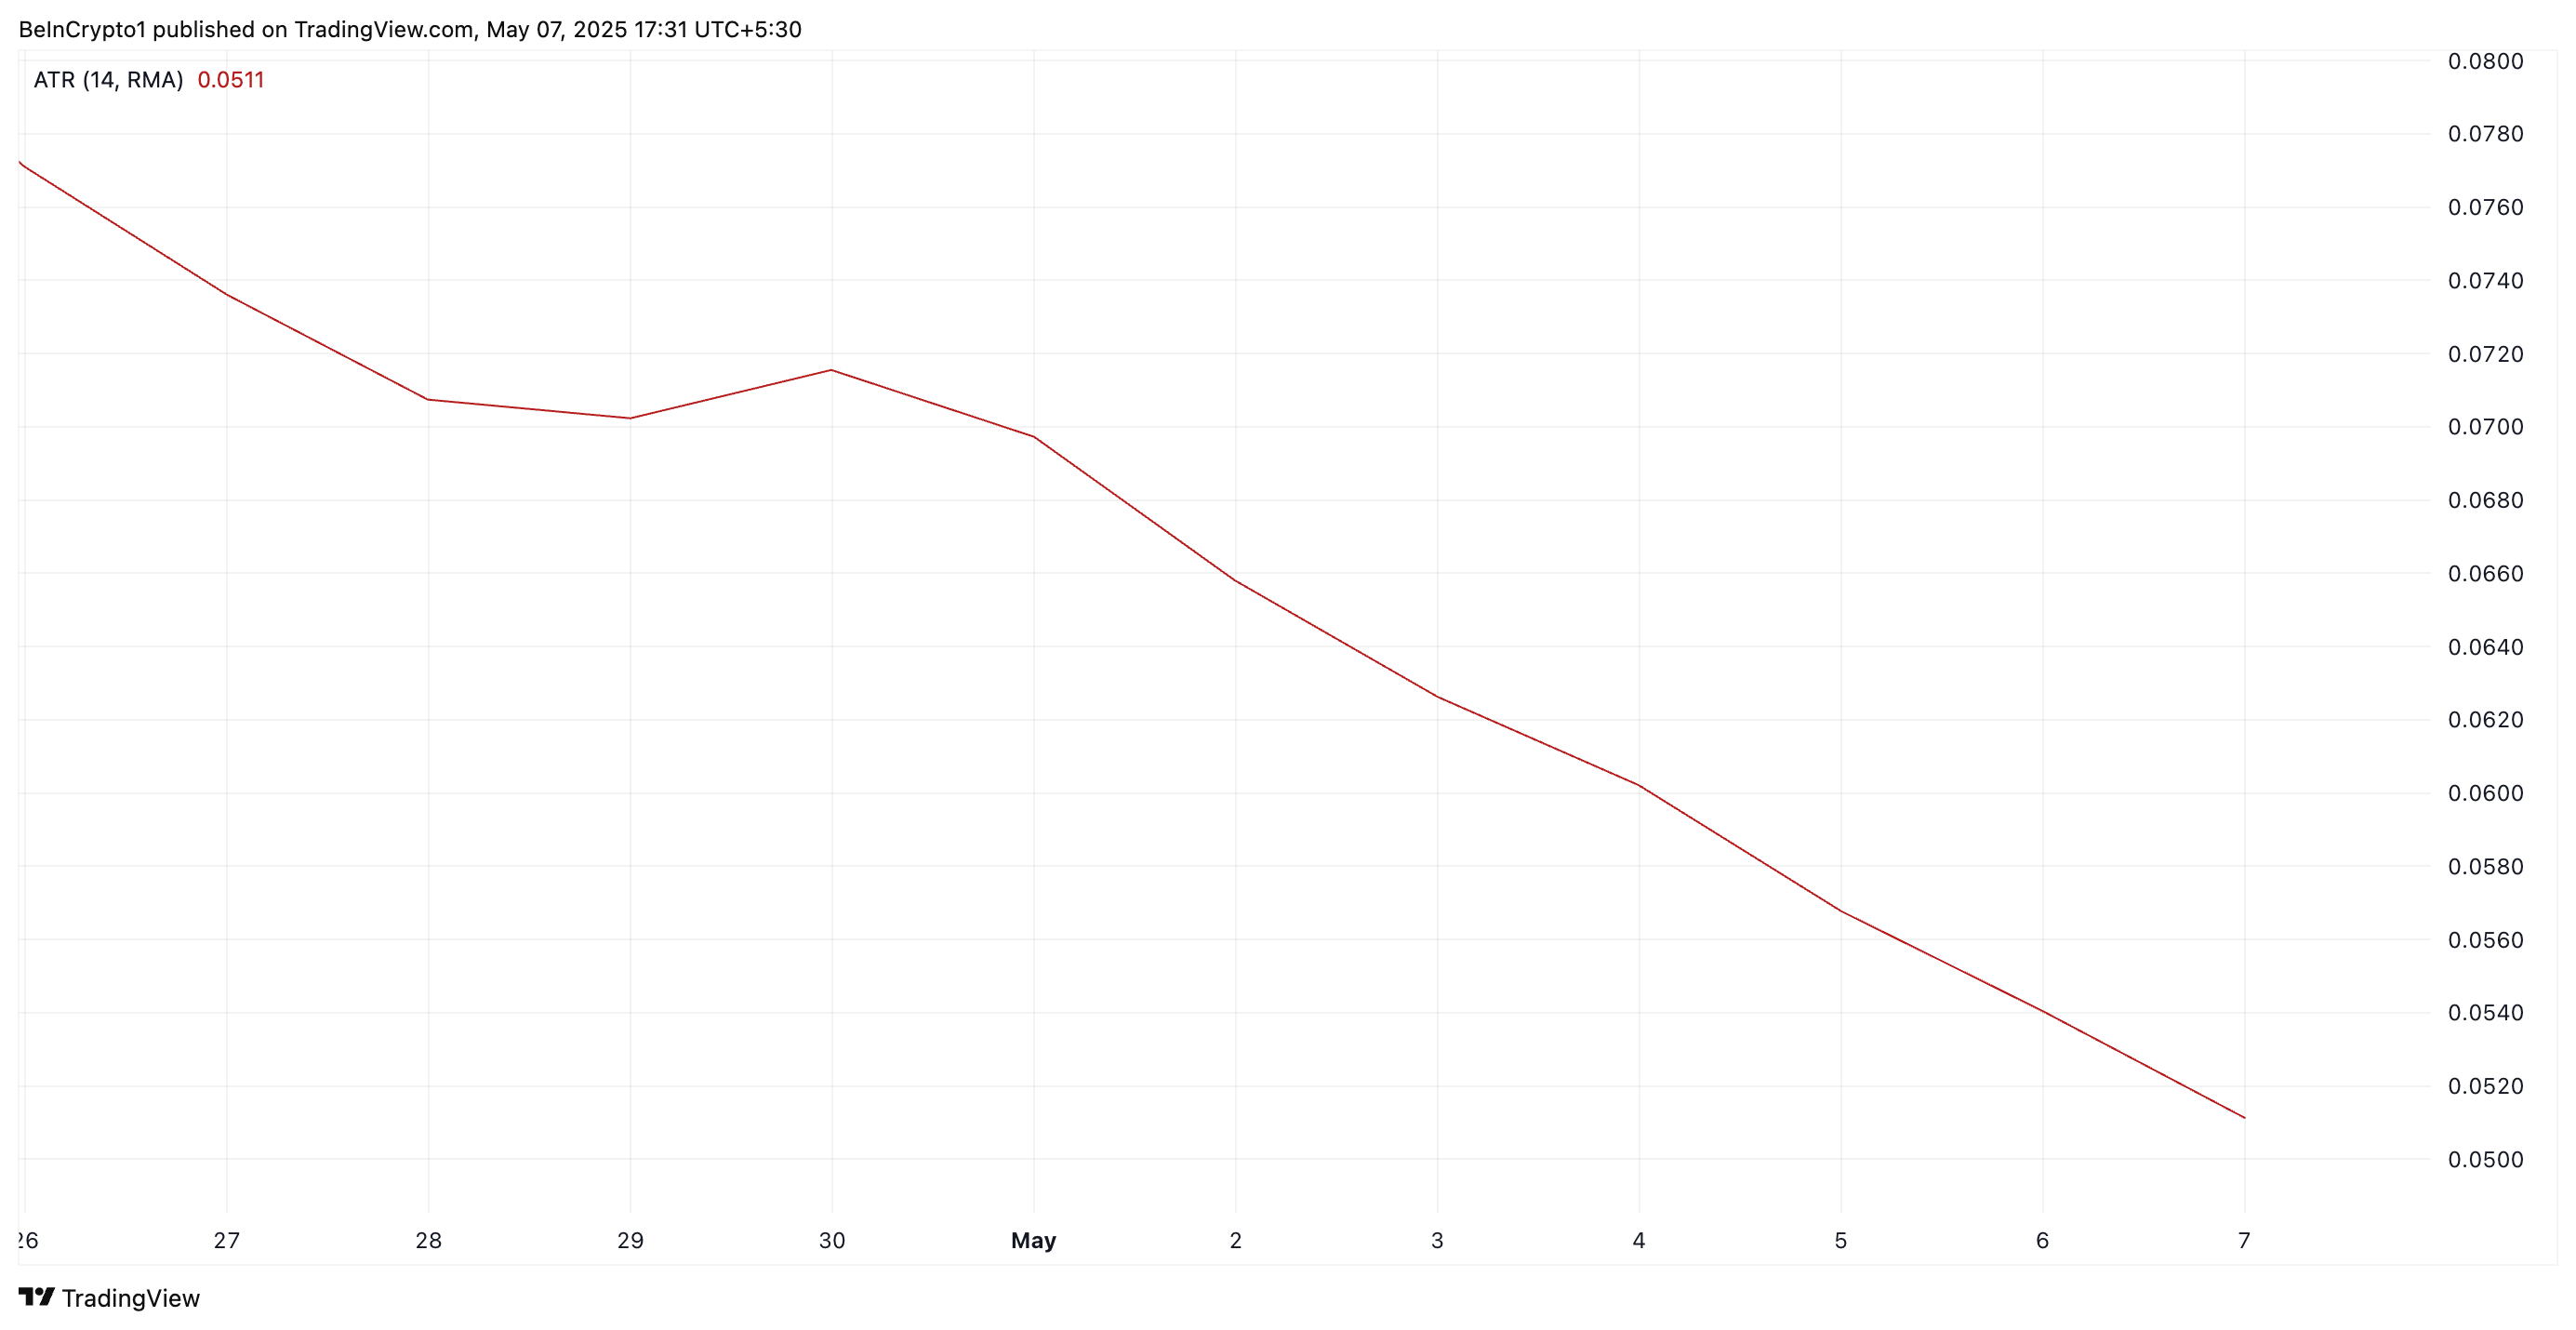 PI ATR. Source:
TradingView
PI ATR. Source:
TradingView
The ATR indicator measures the degree of price movement over a given period. When it trends downward like this, it often suggests that price fluctuations are narrowing and momentum is weakening.
PI Bulls Eye $1.01, While Bears Target $0.40
As of this writing, PI trades at $0.58, resting just above the key support level formed at $0.57. This zone has served as a critical level for the token throughout its consolidation phase, repeatedly preventing downward pressure.
If selloffs surge and PI breaks below this price floor, it could fall to its all-time low of $0.40.
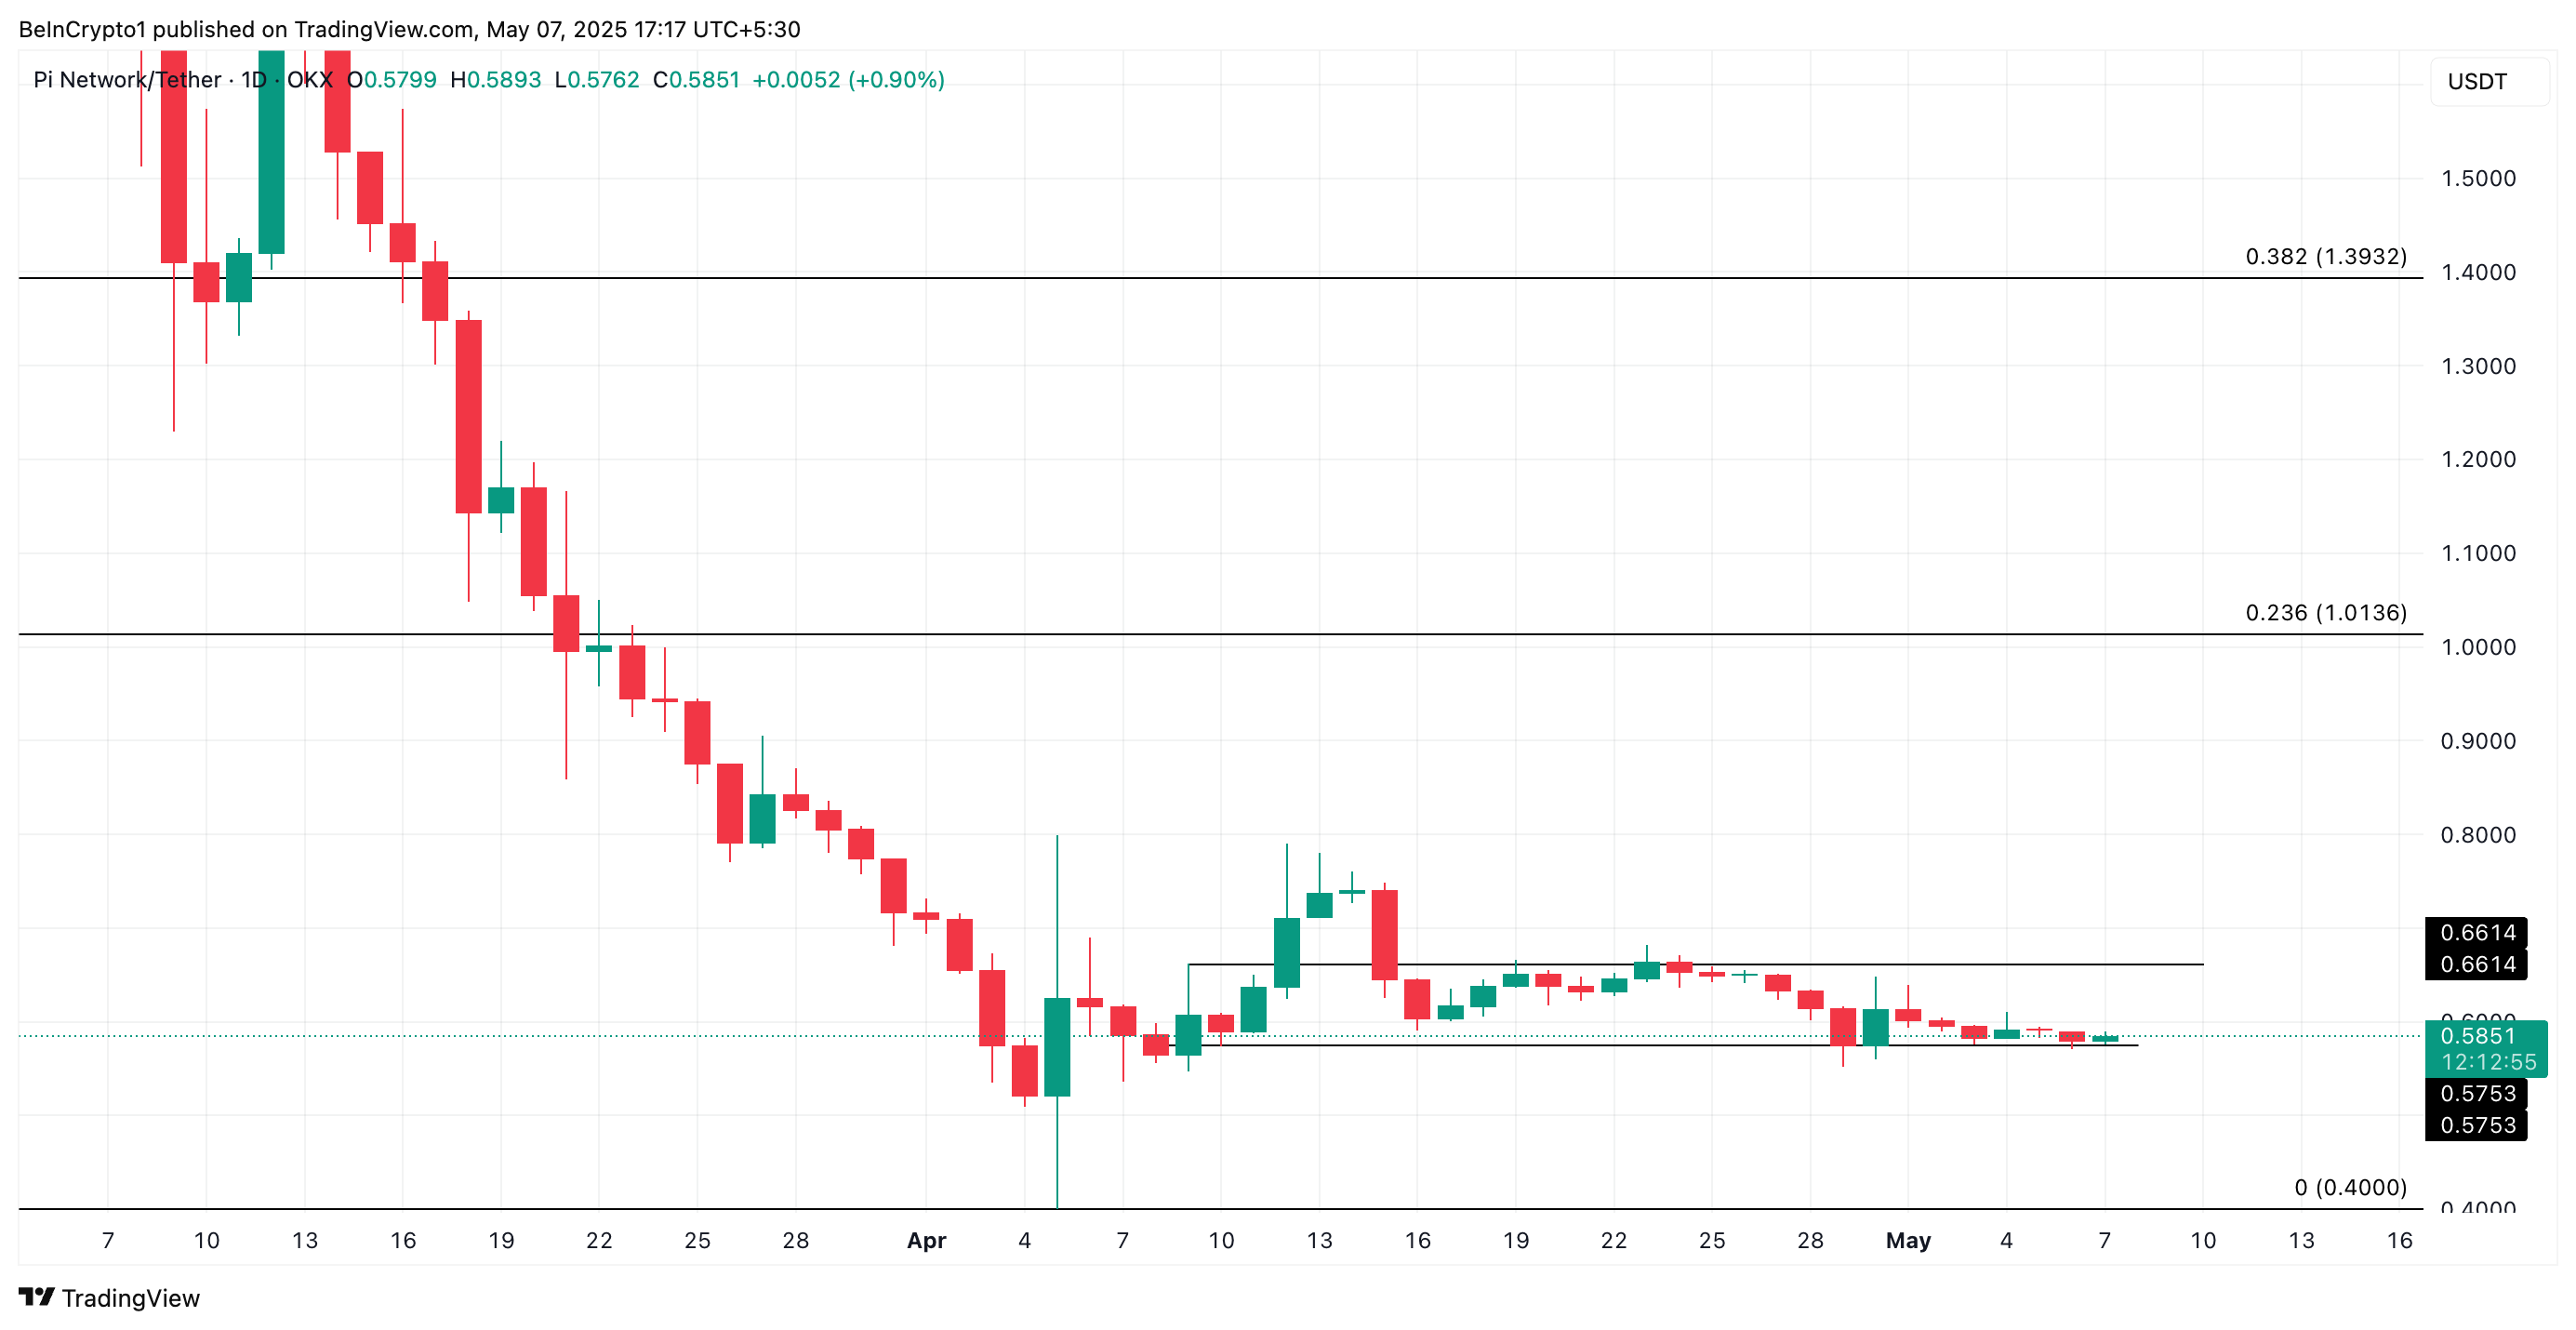 PI Price Analysis. Source:
TradingView
PI Price Analysis. Source:
TradingView
On the other hand, if bullish momentum spikes and the PI token breaks above $0.66, it could climb to $1.01.
Disclaimer: The content of this article solely reflects the author's opinion and does not represent the platform in any capacity. This article is not intended to serve as a reference for making investment decisions.
You may also like
CandyBomb x RAVE: Trade futures to share 200,000 RAVE!
Bitget TradFi: Trade gold, forex, and more assets in one account
CandyBomb x US: Trade to share 5,400,000 US
[Initial Listing] Bitget to list Almanak (ALMANAK). Grab a share of 4,200,000 ALMANAK