
Dogecoin Price Prediction: DOGE Surges to $0.2256 as Meme Coins Continue Their 2025 Momentum – Will It Join Bitcoin’s Boom?

By:Arslan Butt
Disclaimer: Crypto is a high-risk asset class. This article is provided for informational purposes and does not constitute investment advice. You could lose all of your capital.
 Dogecoin Price Prediction: DOGE Surges to $0.2256 as Meme Coins Continue Their 2025 Momentum - Will It Join Bitcoin's Boom?
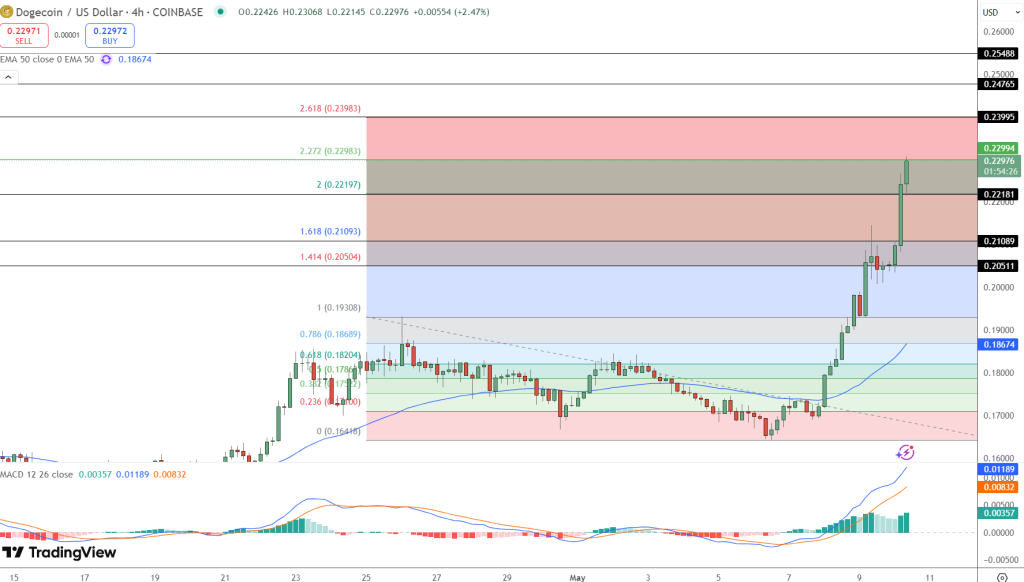
Dogecoin (DOGE) is trading at $0.2297, reflecting strong bullish momentum as it tests critical resistance levels. The recent price surge has been fueled by the formation of a “Three White Soldiers” candlestick pattern, a classic bullish reversal signal characterized by three consecutive long green candles with small or no wicks.
This formation often marks the start of a strong uptrend, indicating sustained buying interest. The breakout above the 1.618 Fibonacci extension at $0.2109 has further reinforced this positive sentiment, with DOGE now testing the 2.272 extension at $0.2298.
EMA and MACD Indicators Signal Continued Uptrend; Dogecoin Supported
The 50-day Exponential Moving Average (EMA) at $0.1867 has provided consistent support throughout this rally, confirming the strength of the upward trend. DOGE’s price remains comfortably above this level, reflecting strong market confidence.
The MACD also supports this view, showing a positive crossover with the MACD line well above the signal line, highlighting accelerating bullish momentum.
This combination of supportive technical indicators suggests that the current uptrend may have more room to run.
Dogecoin Outlook: Key Price Levels and Potential Pullbacks
Looking at key price levels, immediate resistance lies at the 2.272 Fibonacci extension of $0.2298, followed by the 2.618 extension at $0.2398.
A break above these levels could clear the path for DOGE to challenge the psychologically significant $0.2476 mark.
On the downside, immediate support is at $0.2109, the 1.618 Fibonacci extension, which recently flipped from resistance to support.
Below this, the next significant support levels are at $0.2050 (1.414 Fibonacci) and the 50 EMA at $0.1867, which remains a critical level for maintaining the bullish trend.
Conclusion and Trade Outlook
In summary, Dogecoin price prediction seems bullish as recent price action is supported by a strong technical setup, including the “Three White Soldiers” pattern, a bullish MACD crossover, and steady support from the 50 EMA.
Traders should watch for a confirmed breakout above $0.2298 to target higher levels around $0.2398, while a pullback below $0.2109 could indicate a potential correction.
BTC Bull Token Crosses $5.54M as Flexible 78% Staking Yield Draws Investors
BTC Bull Token ($BTCBULL) continues to gain traction, crossing $5.54 million in funds raised as it nears its $6.27 million presale cap.
Priced at $0.002505, the token has positioned itself as more than just a meme coin—offering real utility through flexible, high-yield staking.
Utility-Driven Tokenomics Fuel Demand
Unlike typical meme tokens, BTCBULL blends crypto culture appeal with tangible staking rewards. Investors can currently earn an estimated 78% APY while keeping their tokens fully liquid—unstaking is allowed at any time without penalties or lockup periods.
This model has resonated with investors who seek yield without sacrificing access, especially in a volatile crypto environment.

Current Presale Stats:
- USDT Raised: $5,544,498 of $6,272,266
- Current Price: $0.002505 per BTCBULL
- Staking Pool Total: 1,342,549,903 BTCBULL
- Estimated Yield: 78% annually
With less than $727K left before the next milestone, the presale window is narrowing fast. For investors chasing high yields with exit flexibility, BTCBULL is becoming an increasingly compelling contender in the 2025 crypto cycle.
0
0
Disclaimer: The content of this article solely reflects the author's opinion and does not represent the platform in any capacity. This article is not intended to serve as a reference for making investment decisions.
PoolX: Earn new token airdrops
Lock your assets and earn 10%+ APR
Lock now!
You may also like
[Initial listing] Bitget to list Cysic (CYS) in the Innovation zone
Bitget Announcement•2025/12/11 03:00
Earn up to 50 USDT: Make your first USD deposit!
Bitget Announcement•2025/12/10 08:00
[Initial listing] Bitget to list Talus (US) in the Innovation and AI zone
Bitget Announcement•2025/12/09 15:00
Bitget Trading Club Championship (Phase 21)—Up to 1250 BGB per user, plus a ZETA pool and Mystery Boxes
Bitget Announcement•2025/12/09 08:00
Trending news
MoreCrypto prices
MoreBitcoin
BTC
$90,111.33
-2.73%
Ethereum
ETH
$3,196.35
-3.85%
Tether USDt
USDT
$1
+0.02%
XRP
XRP
$2.01
-3.85%
BNB
BNB
$868.72
-2.43%
USDC
USDC
$0.9998
-0.00%
Solana
SOL
$130.82
-6.05%
TRON
TRX
$0.2794
-0.38%
Dogecoin
DOGE
$0.1385
-5.86%
Cardano
ADA
$0.4307
-7.23%
How to buy BTC
Bitget lists BTC – Buy or sell BTC quickly on Bitget!
Trade now
Become a trader now?A welcome pack worth 6200 USDT for new users!
Sign up now