

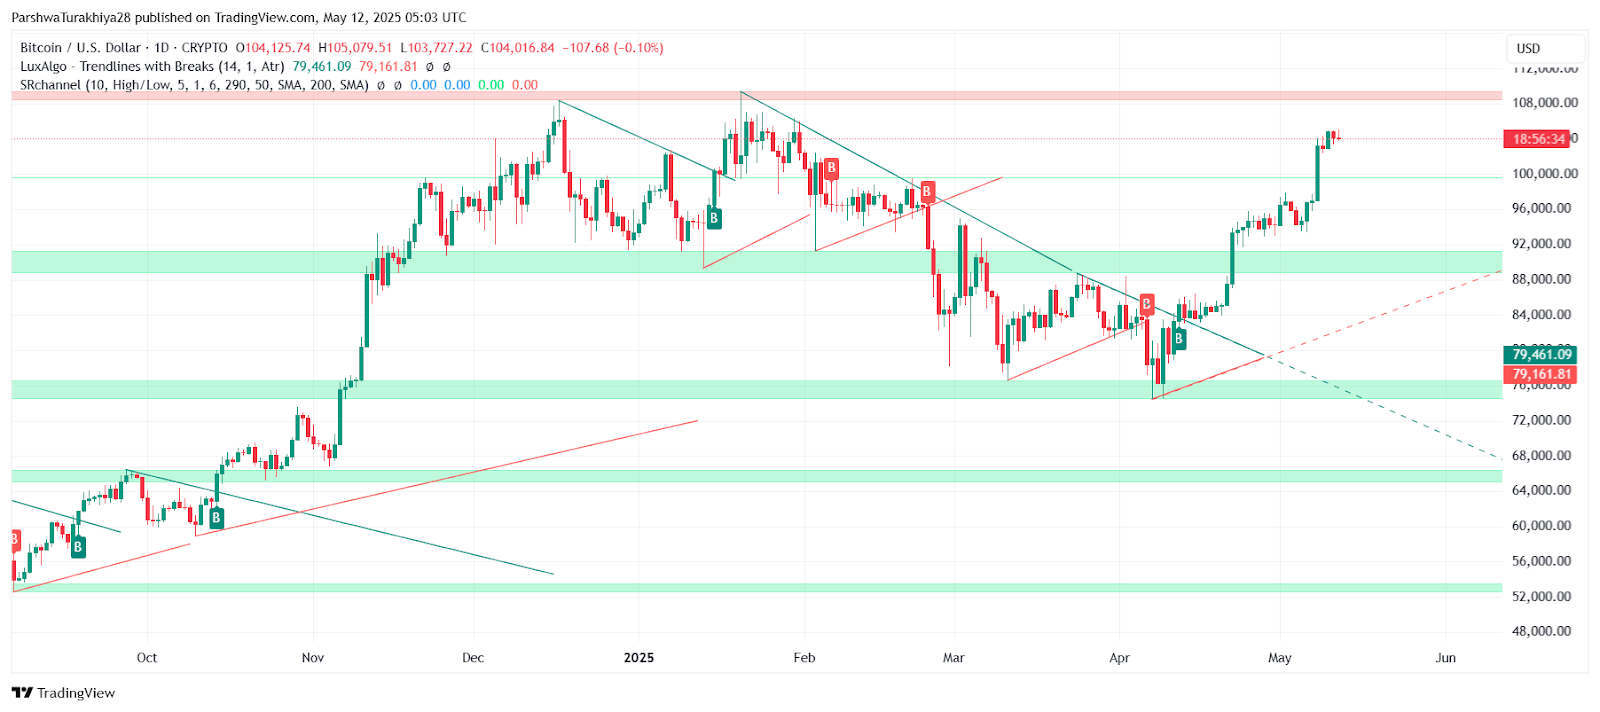
After surging from sub-$90K levels in April, the Bitcoin price today is hovering around $104,000, showing signs of exhaustion just below the $105,000 resistance zone. On the daily chart, BTC has moved into a crucial supply area that previously triggered sharp rejections, suggesting buyers are becoming cautious.
 BTCUSD price dynamics (Source: TradingView)
The rally that began with a breakout above $95,000 now faces key resistance between $104,000 and $106,000, a zone marked by multiple historical rejections. At the time of writing, Bitcoin price trades with mild intraday losses, showing -0.1% on the day and a potential pause after a strong weekly move.
Bitcoin Price Action Near-Term: Key Indicators Show Divergence
 BTCUSD price dynamics (Source: TradingView)
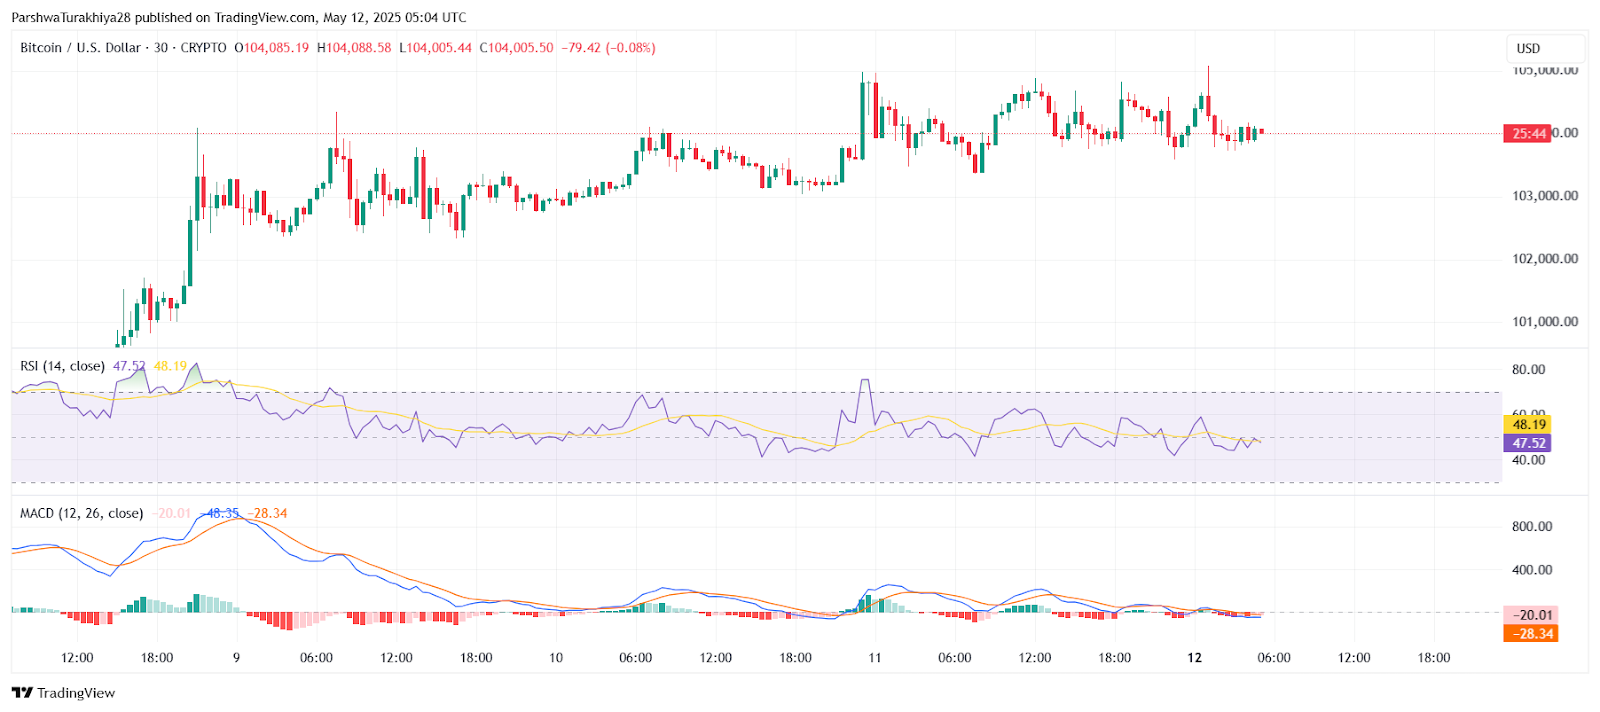
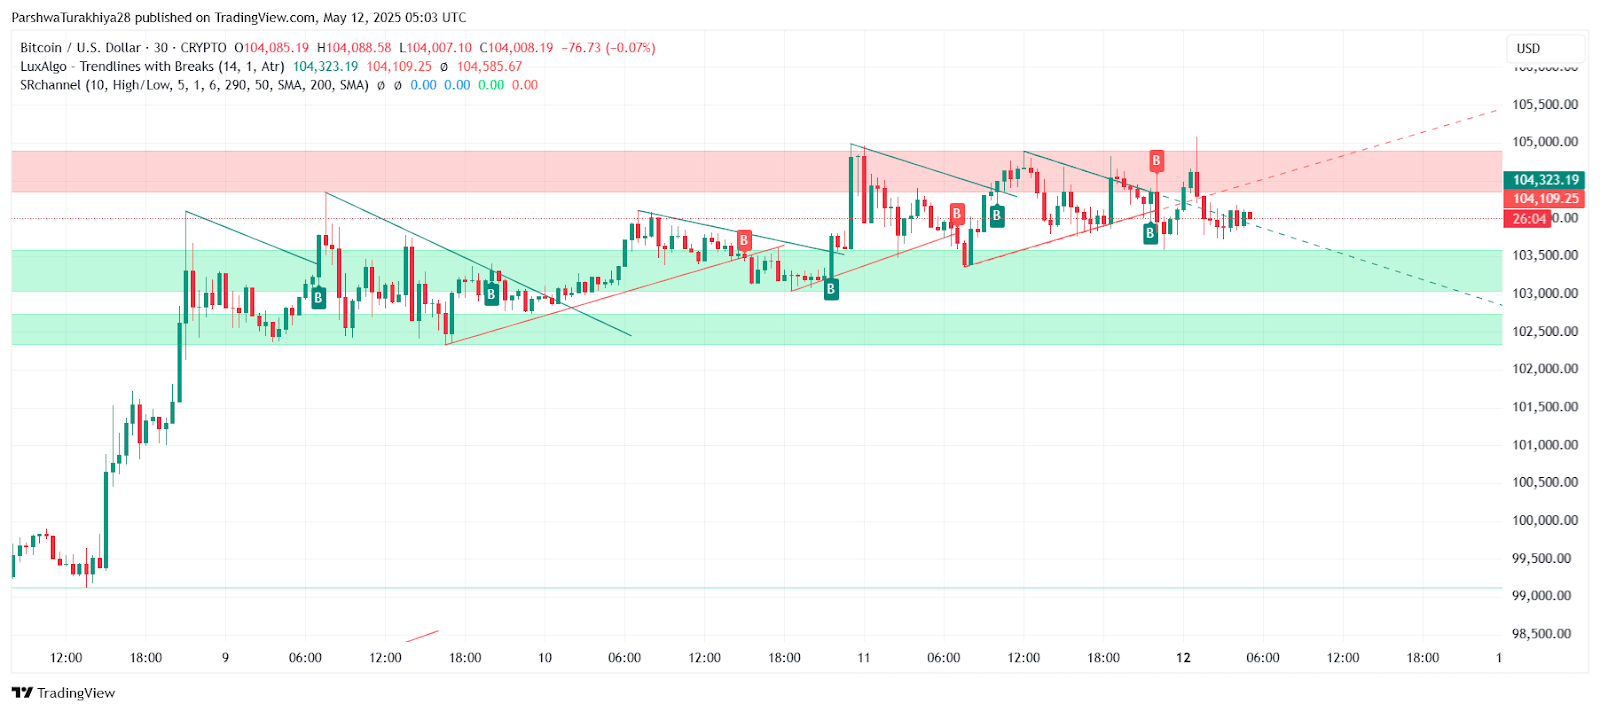
On the 30-minute chart, BTC remains in an elevated structure but is trading sideways with a flattening bias. The RSI is currently at 47.5 — just below the neutral 50 mark — signaling a loss in bullish momentum. Meanwhile, the MACD histogram is narrowing and hovering near the zero line, indicating waning momentum. This aligns with the sideways movement seen since May 10.
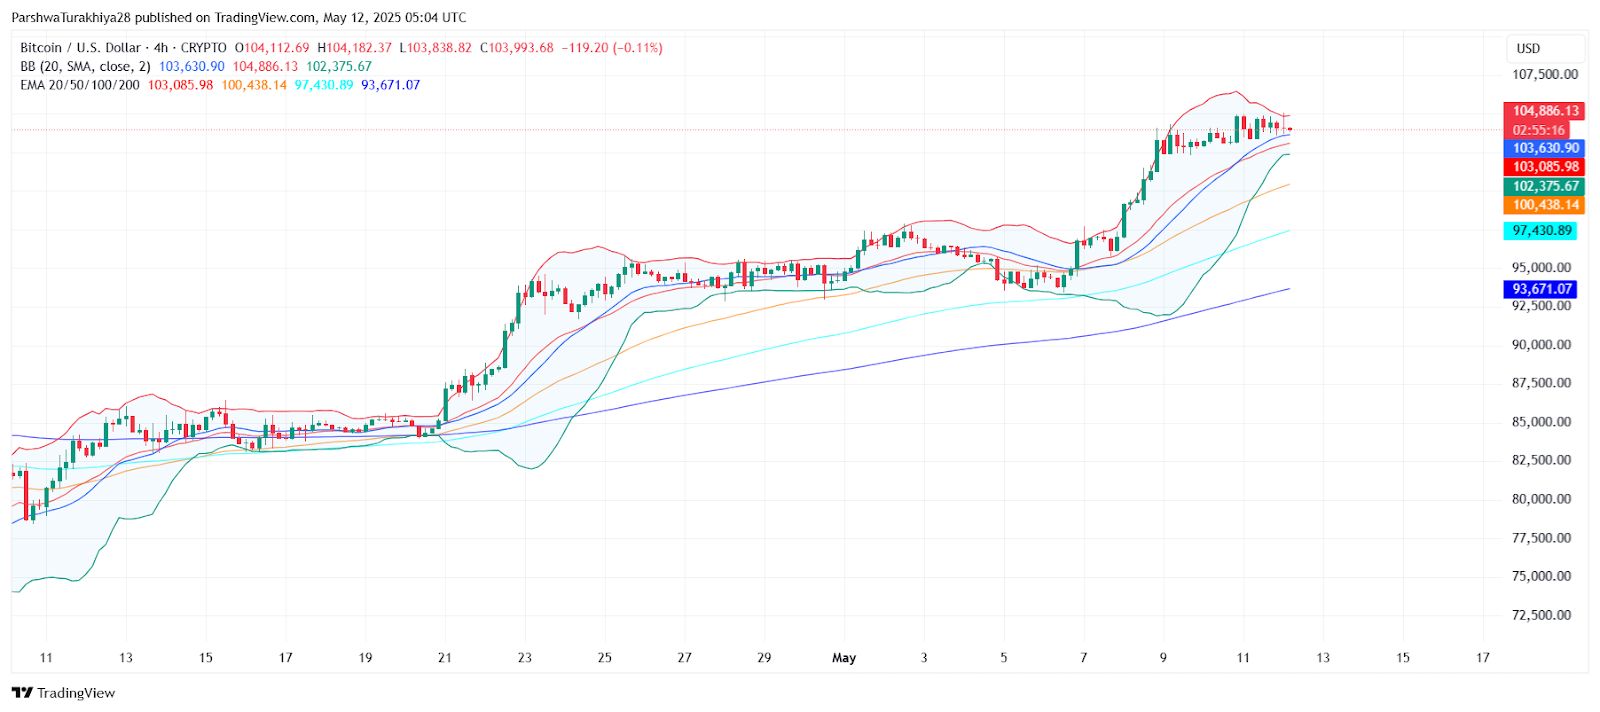
Bollinger Bands are compressing around the $104K zone, a common precursor to a breakout. However, the candles are showing smaller body formations, reinforcing the lack of directional conviction. This increases the probability of a volatility event over the next 24 hours.
 BTCUSD price dynamics (Source: TradingView)
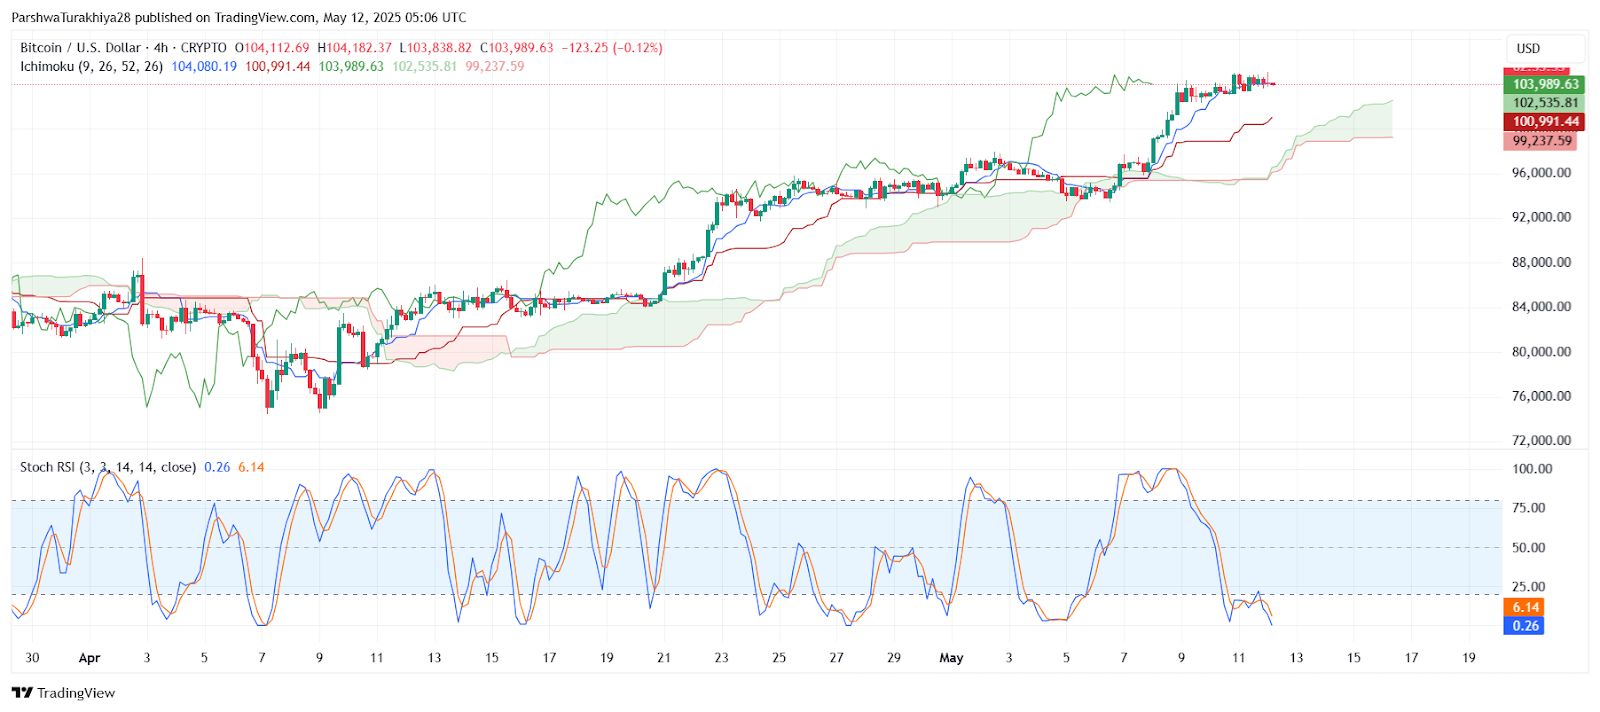
In addition, the Ichimoku Cloud on the 4H timeframe shows BTC trading above the cloud, with flat Tenkan-Sen and Kijun-Sen lines — a classic signal of trend pause. If Bitcoin price volatility expands, the next breakout could be rapid.
Why Bitcoin Price Going Down/Up Today? Battle at $105K Defines Outlook
The price remains caught between a short-term consolidation phase and a strong macro uptrend. The 30-minute chart shows a tight range forming between $103,800 support and $104,800 resistance, with neither bulls nor bears showing full control.
 BTCUSD price dynamics (Source: TradingView)
Bitcoin price spikes earlier in the week were triggered by a clean triangle breakout above $101K, but recent candles have failed to close convincingly above $104.5K. Trendline breaks and volume signals on the intraday chart suggest a possible minor correction if $103.5K fails to hold.
That said, there is no clear reversal pattern yet. The underlying structure still favors buyers above the 200 EMA, which sits near $97,400 on the 4-hour chart. A failure to break above $105K could trigger a test of the $102,500–$103,200 support band.
Bitcoin Price Forecast for May 13
 BTCUSD price dynamics (Source: TradingView)
Looking ahead, if bulls push Bitcoin price above $105,200 with volume confirmation, the next resistance lies at $107,500 and then $110,000. A decisive breakout from this area could invite fresh long positions.
On the downside, if Bitcoin price today loses the $103,000 handle, a retracement toward $101,500 and the prior breakout zone at $99,000 becomes likely. Key support for bulls to defend remains the $100K psychological level, which also aligns with multiple EMAs and Ichimoku support.
With indicators like Stoch RSI showing oversold levels on the 4-hour chart and MACD flattening, Bitcoin appears ready for a directional move — traders should monitor volume closely for confirmation of breakout or breakdown.
BTC Technical Forecast Table: May 13
| Indicator/Zone | Level (USD) | Signal |
| Resistance 1 | 105,200 | Short-term breakout zone |
| Resistance 2 | 107,500 | Next upside target |
| Support 1 | 103,000 | Near-term holding level |
| Support 2 | 101,500 | Breakdown trigger |
| 200 EMA (4H) | 97,430 | Strong dynamic support |
| RSI (30-min) | 47.5 | Neutral to weak |
| MACD Histogram | Near Zero | Flat momentum |
| Bollinger Band Width | Tight | Volatility expansion likely |
Disclaimer: The information presented in this article is for informational and educational purposes only. The article does not constitute financial advice or advice of any kind. Coin Edition is not responsible for any losses incurred as a result of the utilization of content, products, or services mentioned. Readers are advised to exercise caution before taking any action related to the company.

