

Date: Sun, May 11, 2025 | 09:40 AM GMT
The cryptocurrency market continues to build on its recent strength, with Bitcoin (BTC) and Ethereum (ETH) leading the charge. BTC has crossed the $104K mark, while ETH has soared more than 60% in the past 30 days, now trading just above $2,500 — its highest level in months. This bullish wave is spilling into altcoins too, including Pendle (PENDLE).
PENDLE is currently up over 14% in monthly gains, now trading near $3.83 — and a textbook technical pattern is hinting that this rally may have more room to run.
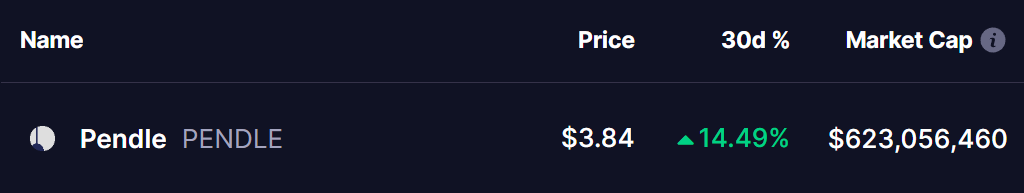 Source: Coinmarketcap
Bullish Adam and Eve Pattern in Play
On the daily chart, PENDLE has formed a textbook bullish Adam and Eve double bottom pattern — a classic setup known for signaling strong reversals from bearish trends to bullish breakouts.
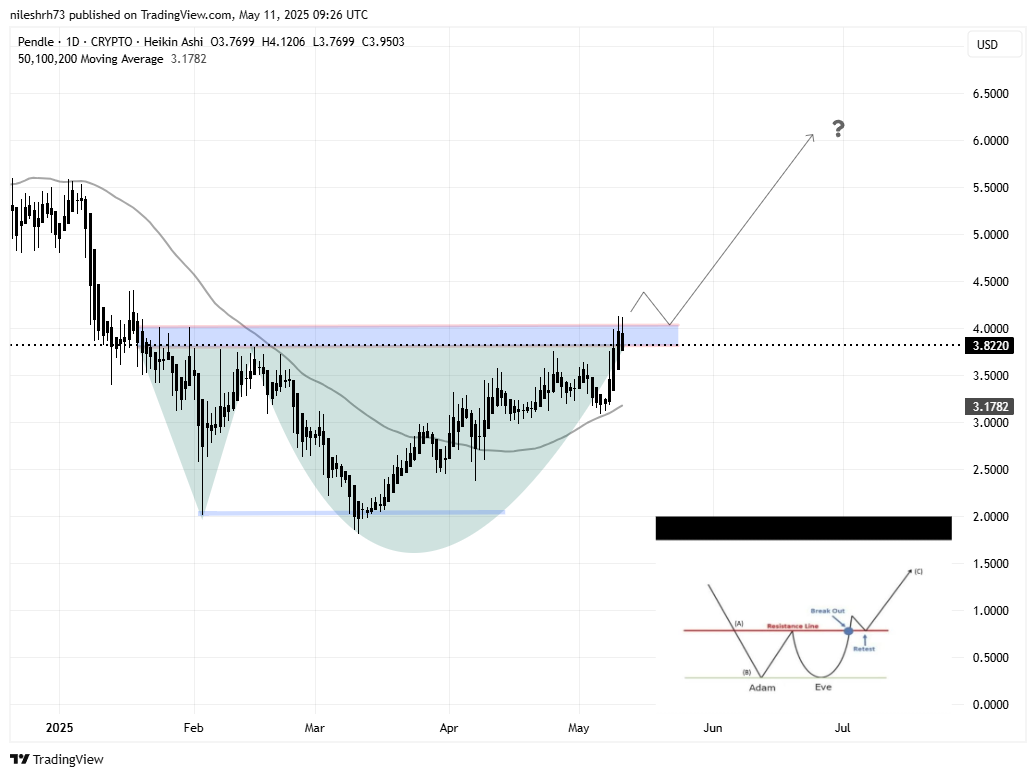 PENDLE Daily Chart/Coinsprobe (Source: Tradingview)
This pattern began developing in late January after PENDLE was rejected from the $4.01 resistance area. The price then sharply dropped to a low of around $2.00, forming the Adam V-shape bottom. After a strong bounce toward the neckline zone, the price dipped again in a more gradual and rounded manner, reaching a low of around $1.81 — forming the Eve portion of the setup.
What followed was a steady recovery, leading the price back up to challenge the neckline at $4.01. As of now, PENDLE is in the middle of attempting a breakout from this key resistance zone.
What to Watch Next?
If it successfully breaks above the $4.01 neckline and confirms with a retest, the pattern implies a technical target near $5.81, which represents a potential 50% rally from the current price levels.
However, traders should watch closely for confirmation. A failed breakout or false move could push the price back into the consolidation range, delaying the bullish continuation.
Disclaimer: This article is for informational purposes only and not financial advice. Always conduct your own research before investing in cryptocurrencies.

