
Is Mantra about to break out? OM reaches key resistance at $0.45

Mantra is approaching a key resistance level that has the potential to make or break OM in the coming weeks.
After weeks of consistent declines, Mantra (OM) is beginning to show signs of potential recovery. On Monday, May 12, OM was trading at $0.4384, up 0.48% in the last 24 hours. The token corrected after reaching a daily high of $0.467, above a crucial resistance level of $0.45.
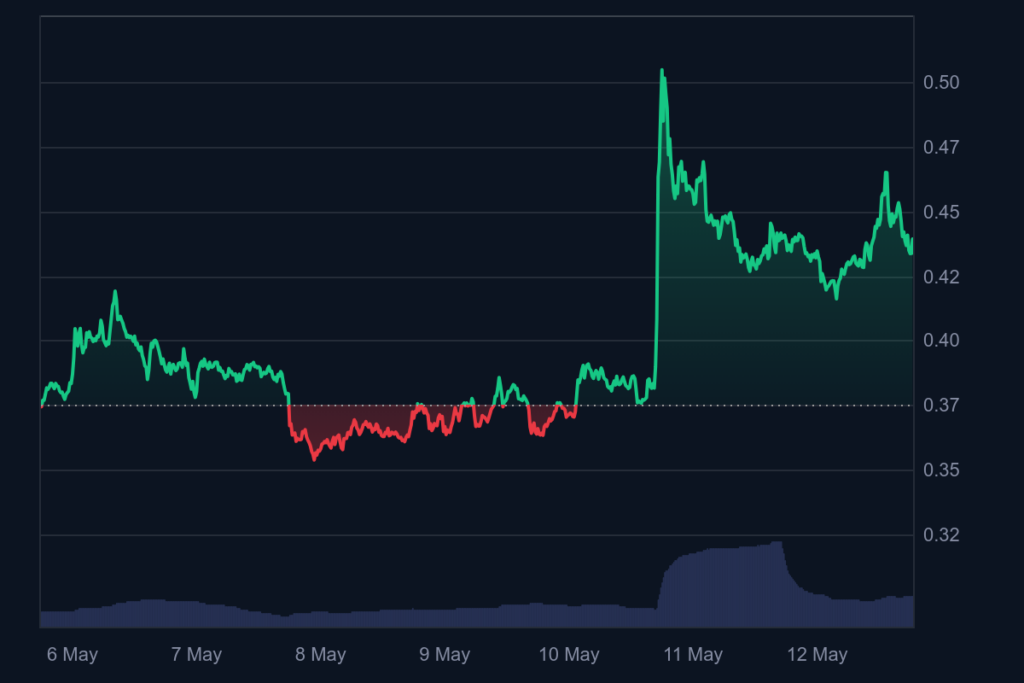 Mantra (OM) price in the last 7 days | Source: CoinMarketCap
The bounce came after an even stronger performance over the previous weekend. On Sunday, May 11, the token surged 40% from $0.37 to a weekly high of $0.52. The surge helped the price break above the 20-day simple moving average at around $0.45 .
While the token did not hold above that resistance level, it is still trading above the $0.38 support. What is more, the relative strength index is at 23 points, suggesting slightly oversold levels.
Can Mantra recover?
Despite some positive momentum in the past few days, the big picture for Mantra is still bearish. The token is below both the 20-day EMA at $0.51 and the 50-day EMA at $0.74. These key indicators suggest significant bearish momentum, which is compounded by the recent events.
On April 13, Mantra took a nosedive, dropping 95% in just a few hours. While the CEO blamed exchange liquidations for the price fall, several investigators pointed to potential insider selling and market manipulation as the real cause.
The Mantra team made efforts to bring back the trust, with the CEO promising to burn his entire allocation of 150 million tokens , representing almost 10% of the total supply. However, the token burn , completed on April 29, did not have a major impact on the price. Since the token burn, OM dropped from $0.53 to a low of $0.4145.
Disclaimer: The content of this article solely reflects the author's opinion and does not represent the platform in any capacity. This article is not intended to serve as a reference for making investment decisions.
You may also like
New spot margin trading pair — HOLO/USDT!
FUN drops by 32.34% within 24 hours as it faces a steep short-term downturn
- FUN plunged 32.34% in 24 hours to $0.008938, marking a 541.8% monthly loss amid prolonged bearish trends. - Technical breakdowns, elevated selling pressure, and forced liquidations highlight deteriorating market sentiment and risk-off behavior. - Analysts identify key support below $0.0080 as critical, with bearish momentum confirmed by RSI (<30) and MACD indicators. - A trend-following backtest strategy proposes short positions based on technical signals to capitalize on extended downward trajectories.

OPEN has dropped by 189.51% within 24 hours during a significant market pullback
- OPEN's price plummeted 189.51% in 24 hours to $0.8907, marking its largest intraday decline in history. - The token fell 3793.63% over 7 days, matching identical monthly and yearly declines, signaling severe bearish momentum. - Technical analysts cite broken support levels and lack of bullish catalysts as key drivers of the sustained sell-off. - Absence of stabilizing volume or reversal patterns leaves the market vulnerable to further downward pressure.

New spot margin trading pair — LINEA/USDT!