

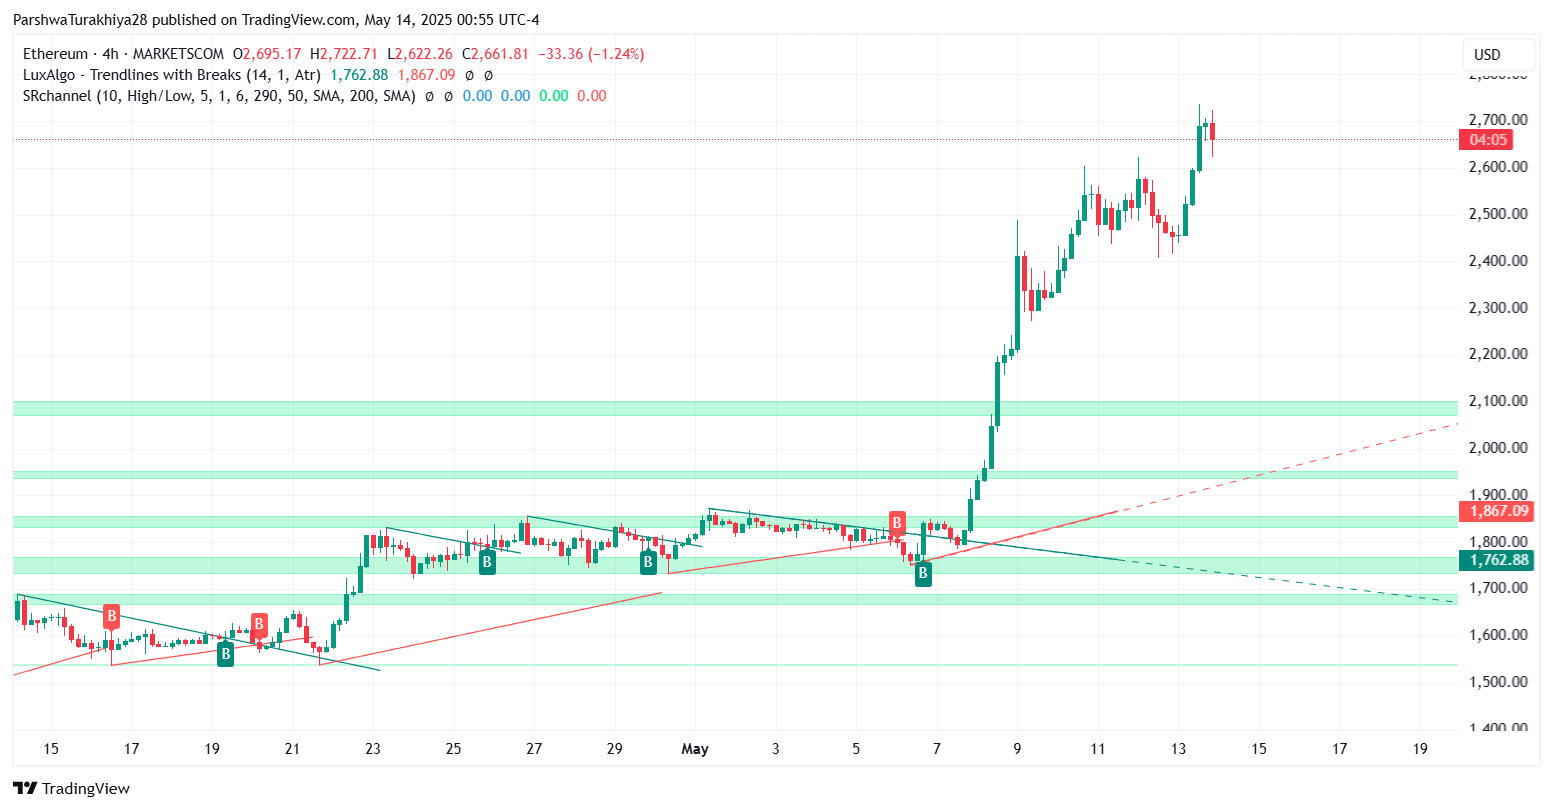
After staging a strong rally from below $2,100 in early May, the Ethereum price today is consolidating just under the $2,700 mark. This level has acted as a psychological barrier after ETH hit a high of $2,722, triggering slight intraday rejection. The recent Ethereum price spikes have brought ETH back into a longer-term descending resistance zone, making this a critical area for trend validation heading into May 15.
What’s Happening With Ethereum’s Price?
 ETH/USD price dynamics (Source: TradingView)
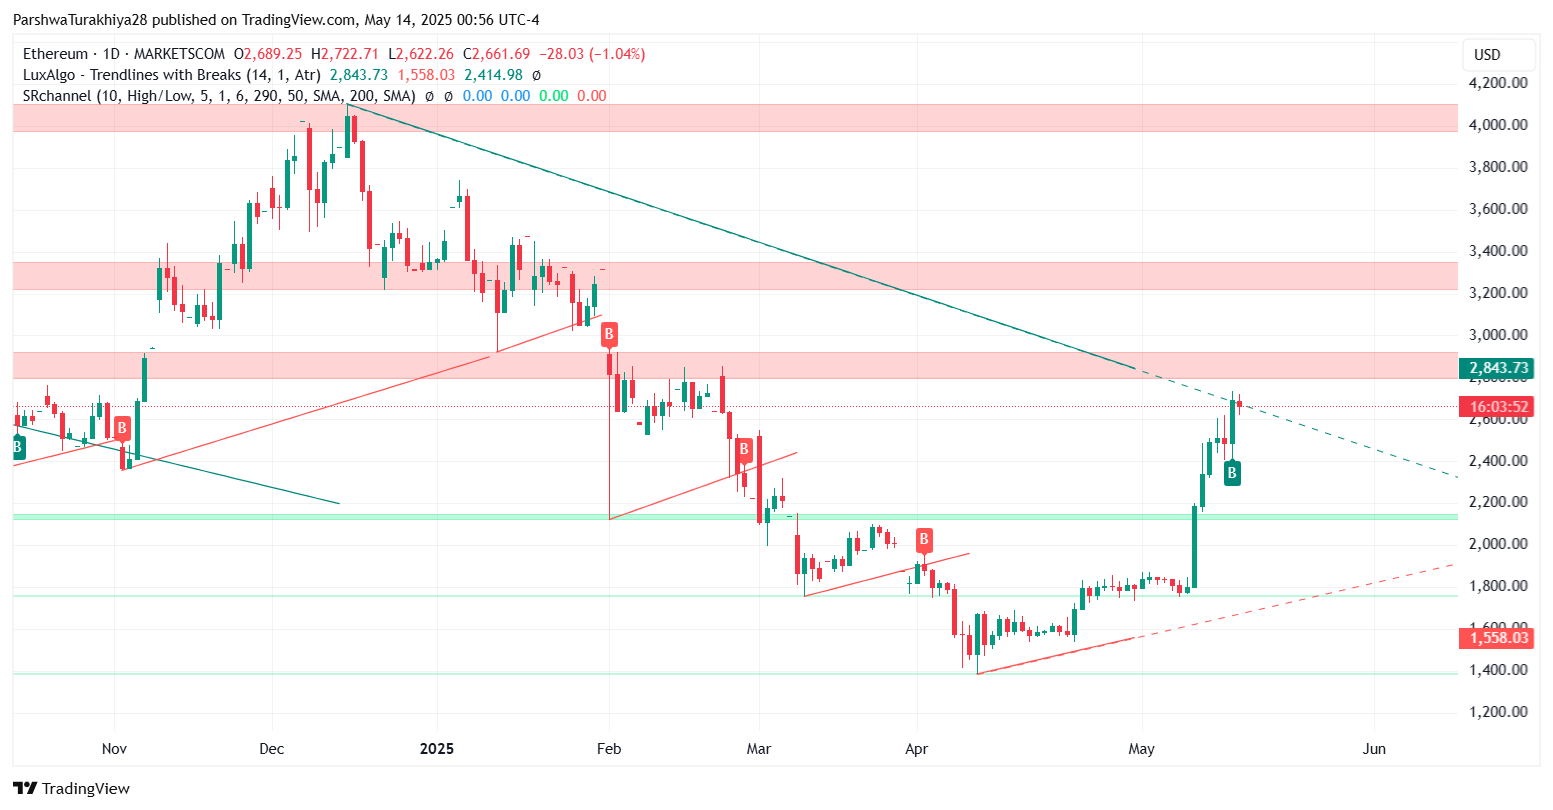
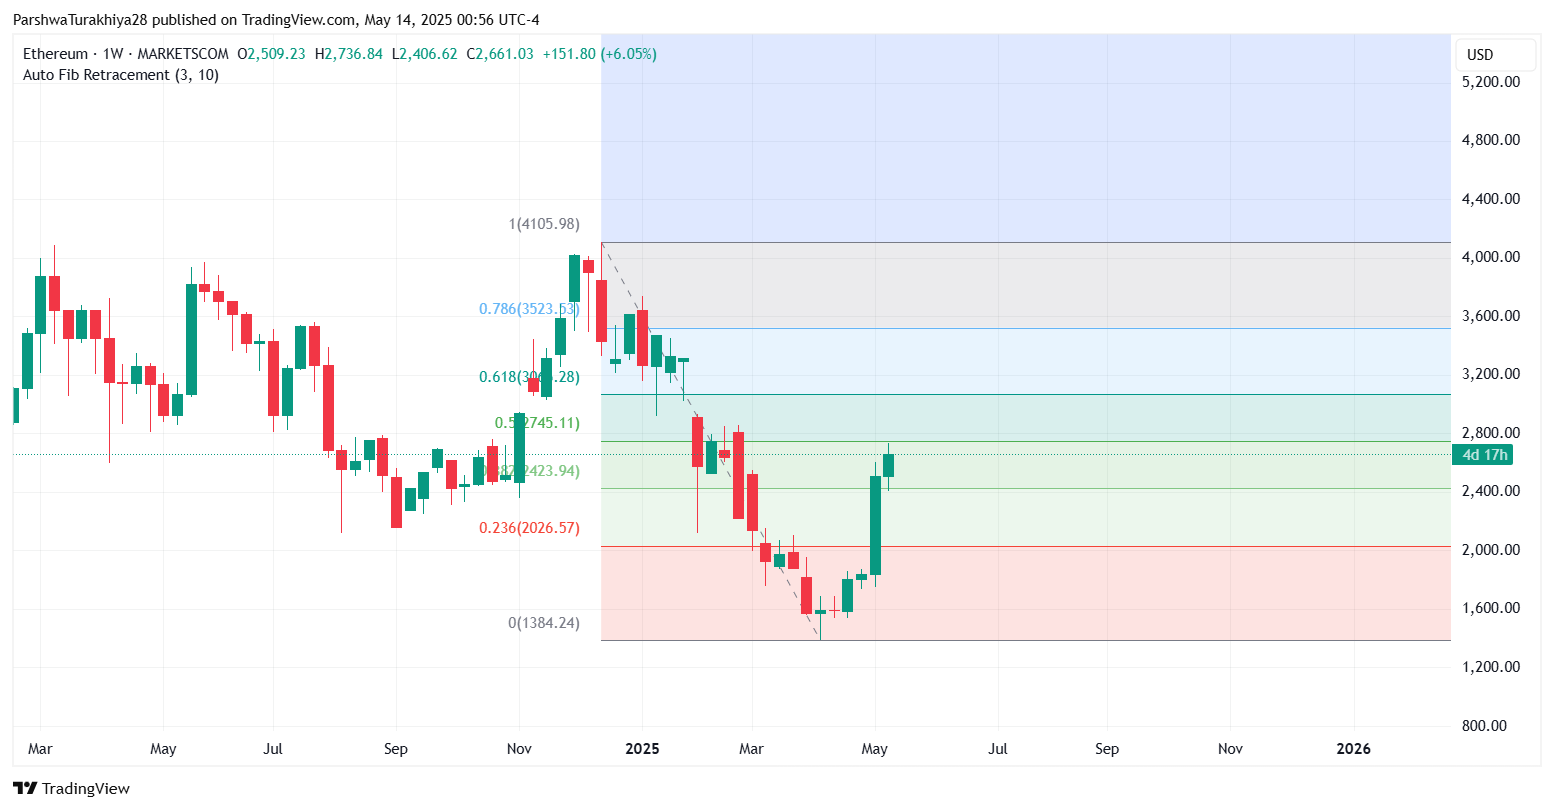
The daily and weekly charts show Ethereum reclaiming bullish control after breaking out of a multi-month falling wedge pattern. On the daily chart, ETH is currently testing a diagonal resistance trendline that stems from the November 2023 highs. This intersects around $2,720–$2,750 — a zone also backed by the 0.5 Fibonacci retracement on the weekly timeframe ($2,745), making it a key pivot area.
 ETH/USD price dynamics (Source: TradingView)
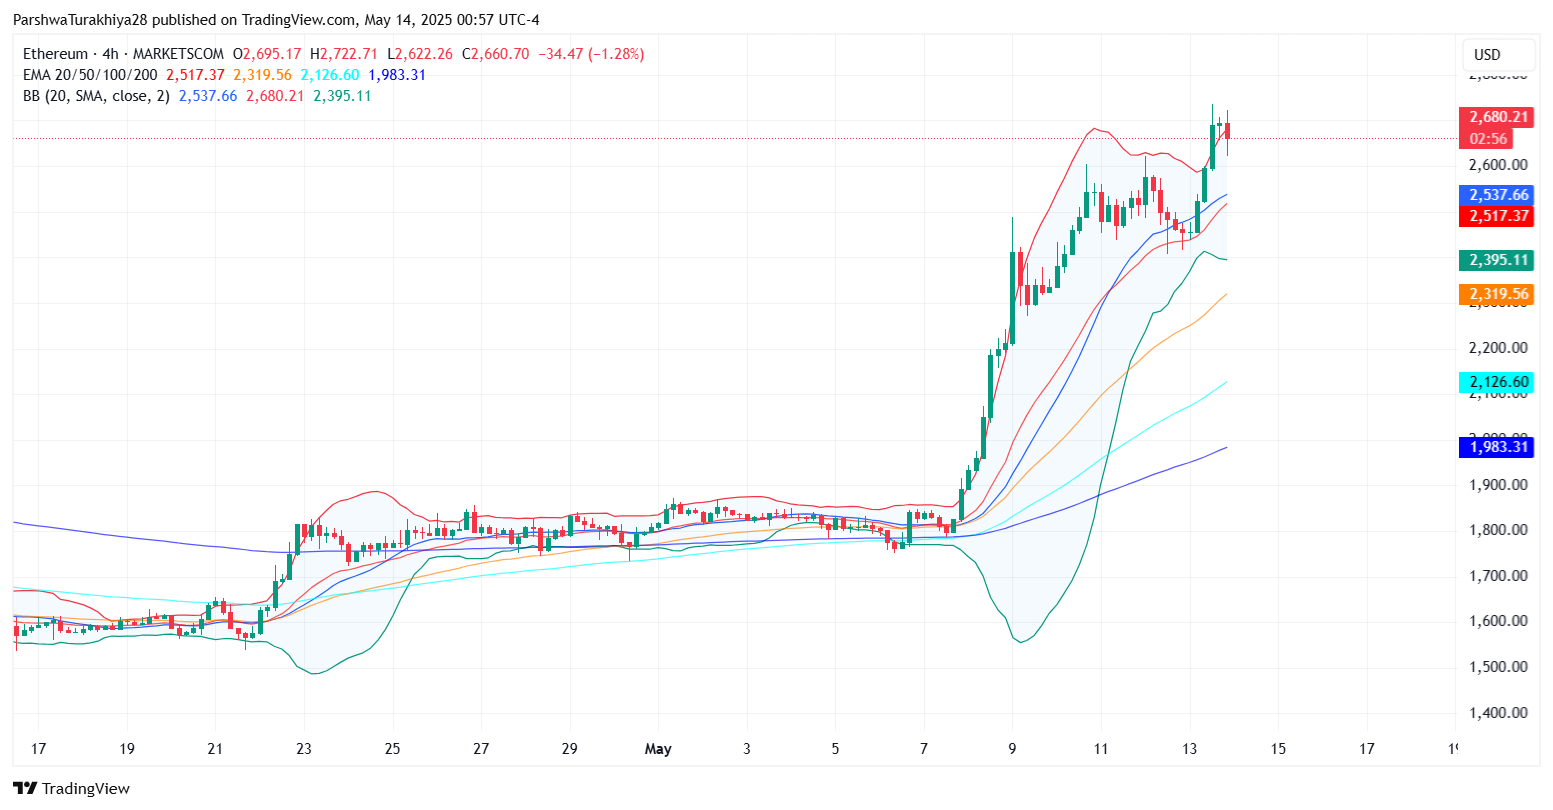
Weekly candles show strong follow-through, and Ethereum price action is now back above both the 0.382 and 0.236 Fib levels, suggesting that this recovery is not just a bounce but potentially a trend reversal. However, the upper Bollinger Band on the 4-hour chart at $2,680 has temporarily capped further upside.
Ethereum Price Action: Sideways Bias Ahead of Breakout
 ETH/USD price dynamics (Source: TradingView)
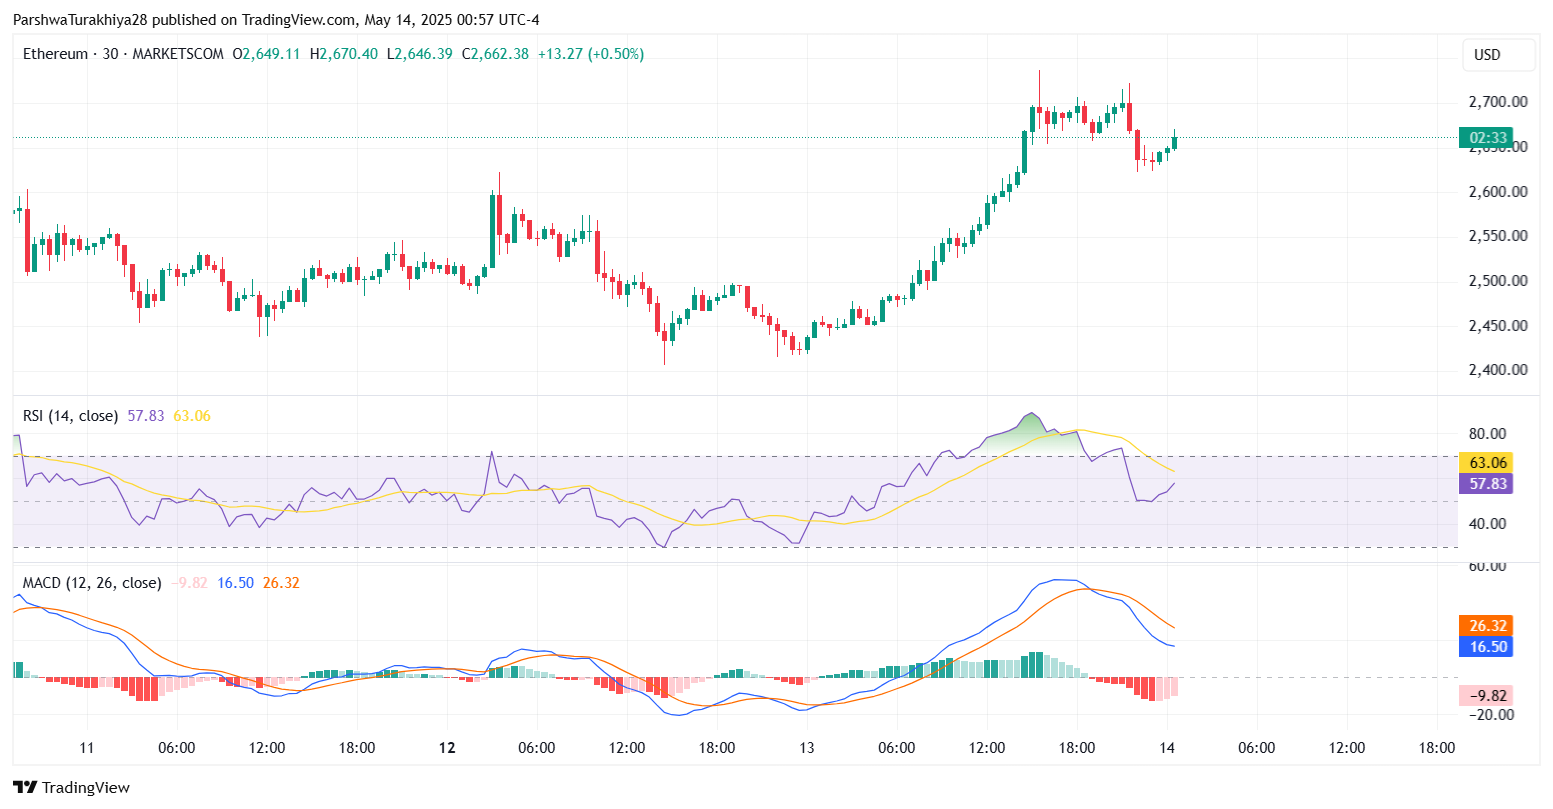
On the 30-minute and 4-hour charts, ETH appears to be forming a bull flag — a continuation pattern that often signals a breakout when volume increases. Candles are compressing just under the $2,680–$2,700 zone, with immediate support sitting around $2,610–$2,640. The 20 EMA on the 4H sits near $2,517, offering dynamic support if a short-term dip occurs.
 ETH/USD price dynamics (Source: TradingView)
The RSI on the 30-minute chart has cooled to 57.83 from overbought territory above 63 earlier, signaling a possible brief pullback before continuation. Meanwhile, MACD shows a narrowing histogram with a minor bearish crossover — not a strong reversal sign yet, but worth watching.
Adding to the short-term uncertainty, Bollinger Bands on the 4-hour timeframe are beginning to contract after last week’s explosive move, indicating that Ethereum price volatility could compress before expanding again.
Why Ethereum Price Going Down Today?
 ETH/USD price dynamics (Source: TradingView)
The question of why Ethereum price going down today can be answered by short-term resistance near $2,720 and early signs of exhaustion. Recent upside moves were driven by a breakout from the $2,100 range and strong momentum through $2,400 and $2,600. However, the price is now facing horizontal and diagonal resistance from both daily and weekly timeframes — around $2,720 to $2,750.
At the same time, ETH remains strongly above key EMAs: the 50 EMA at $2,319 and the 100 EMA at $2,126. The structure continues to favor the bulls as long as Ethereum holds above $2,610–$2,640. A daily close above $2,750 could clear the path to the next resistance band at $2,843 and even the 0.618 weekly Fib level at $3,080.
Short-Term Ethereum Price Outlook for May 15
 ETH/USD price dynamics (Source: TradingView)
Going into May 15, Ethereum appears poised for a breakout if bulls can generate sufficient volume to clear $2,700–$2,745. A clean breakout could push ETH toward $2,843 and potentially $3,000, where weekly resistance clusters reside. On the flip side, a rejection here and loss of $2,610 could bring a retest of $2,517 and $2,480.
Ethereum price update will be highly sensitive to whether this current flag structure breaks upward or downward. Traders should monitor intraday RSI and MACD momentum shifts, along with volume near the $2,700 breakout threshold.
Ethereum Forecast Table: May 15
| Indicator/Zone | Level (USD) | Signal |
| Resistance 1 | 2,720–2,745 | Breakout trigger zone |
| Resistance 2 | 2,843 | Weekly target/resistance |
| Support 1 | 2,610–2,640 | Local support cluster |
| Support 2 | 2,517 | EMA20/Breakdown trigger |
| RSI (30-min) | 57.83 | Cooling from overbought |
| MACD (30-min) | Mild Bearish | Momentum slowing |
| Bollinger Band Width | Tightening | Volatility contraction |
| Pattern | Bullish Flag | Breakout likely if volume rises |
Disclaimer: The information presented in this article is for informational and educational purposes only. The article does not constitute financial advice or advice of any kind. Coin Edition is not responsible for any losses incurred as a result of the utilization of content, products, or services mentioned. Readers are advised to exercise caution before taking any action related to the company.

