

The Bitcoin price today is hovering near $102,400 after bulls failed to close above the $105,000 level on May 14–15. While the broader trend remains bullish, short-term indicators show fading momentum after a multi-week rally that began from $74,000. A rejection from key resistance has left BTC vulnerable to a pullback as traders eye intraday support zones.
What’s Happening with Bitcoin’s Price?
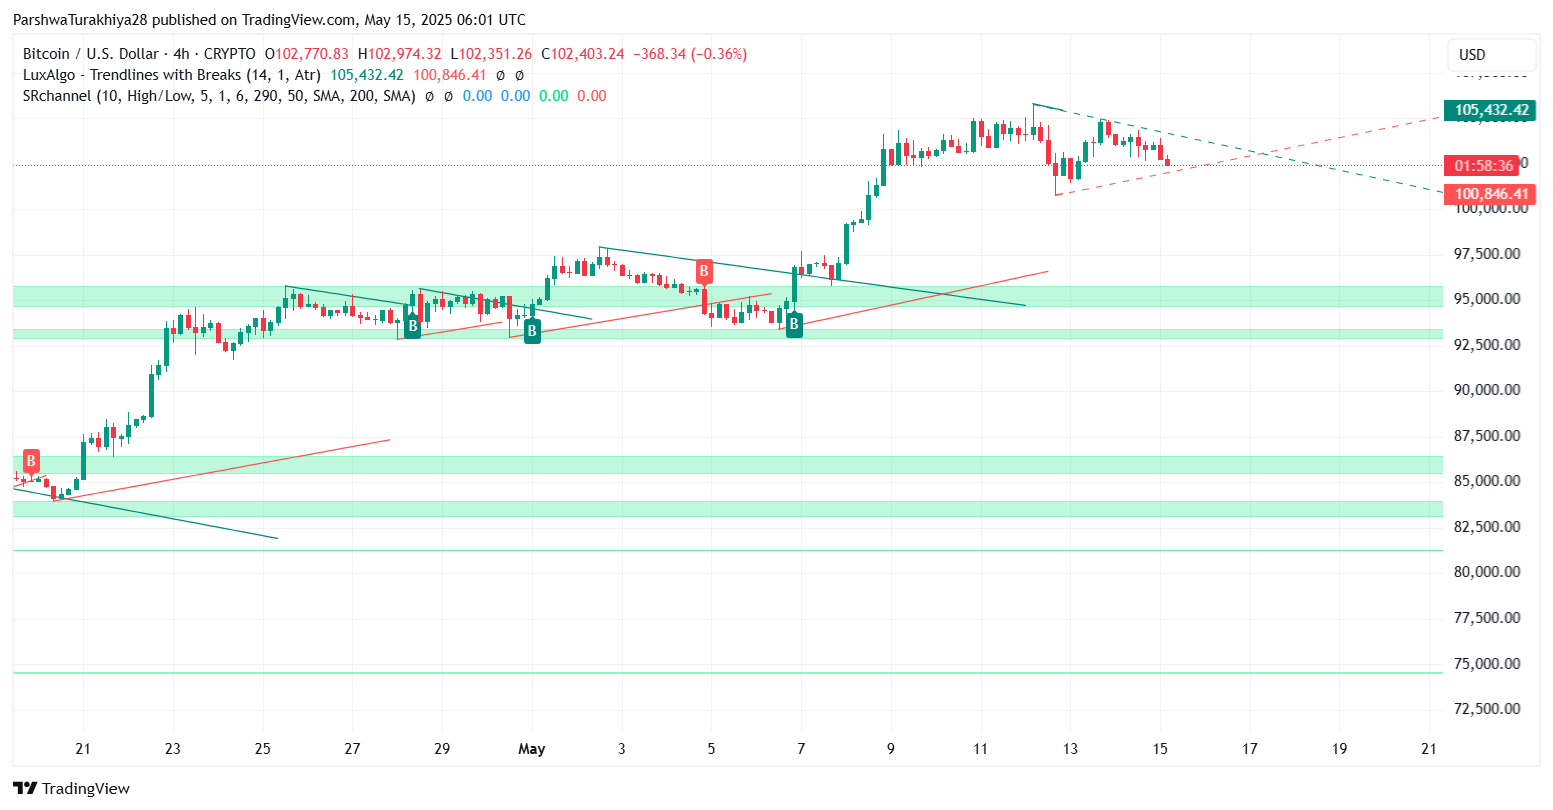
After a sharp rise from $78,000 to $105,700, Bitcoin price action has entered a cooling phase. The 4-hour chart shows BTC forming a narrowing triangle structure with lower highs and horizontal support near $100,800. This range-bound behavior indicates market indecision. At the time of writing, price is testing the lower boundary of this formation.
 BTCUSD price dynamics (Source: TradingView)
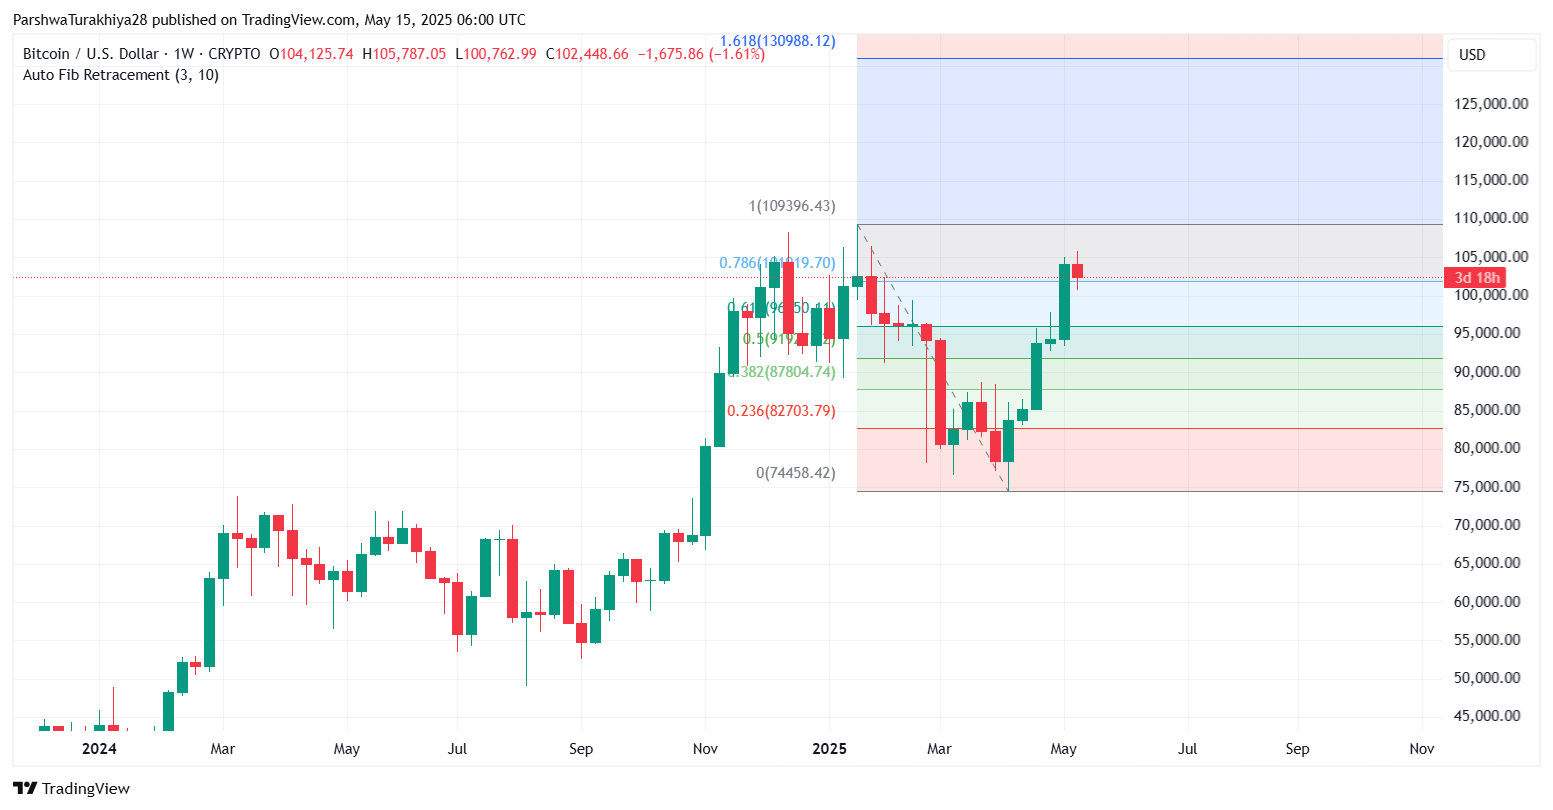
Meanwhile, the weekly Fibonacci chart shows BTC rejecting from the 0.786 retracement level at $101,970 and unable to reclaim the 1.0 Fib at $109,396. This level marks a strong historical resistance. If BTC fails to break above this zone, it could enter a broader retracement phase toward the 0.618 level at $96,556.
Bitcoin Price Faces Intraday Pressure Near Key Support
 BTCUSD price dynamics (Source: TradingView)
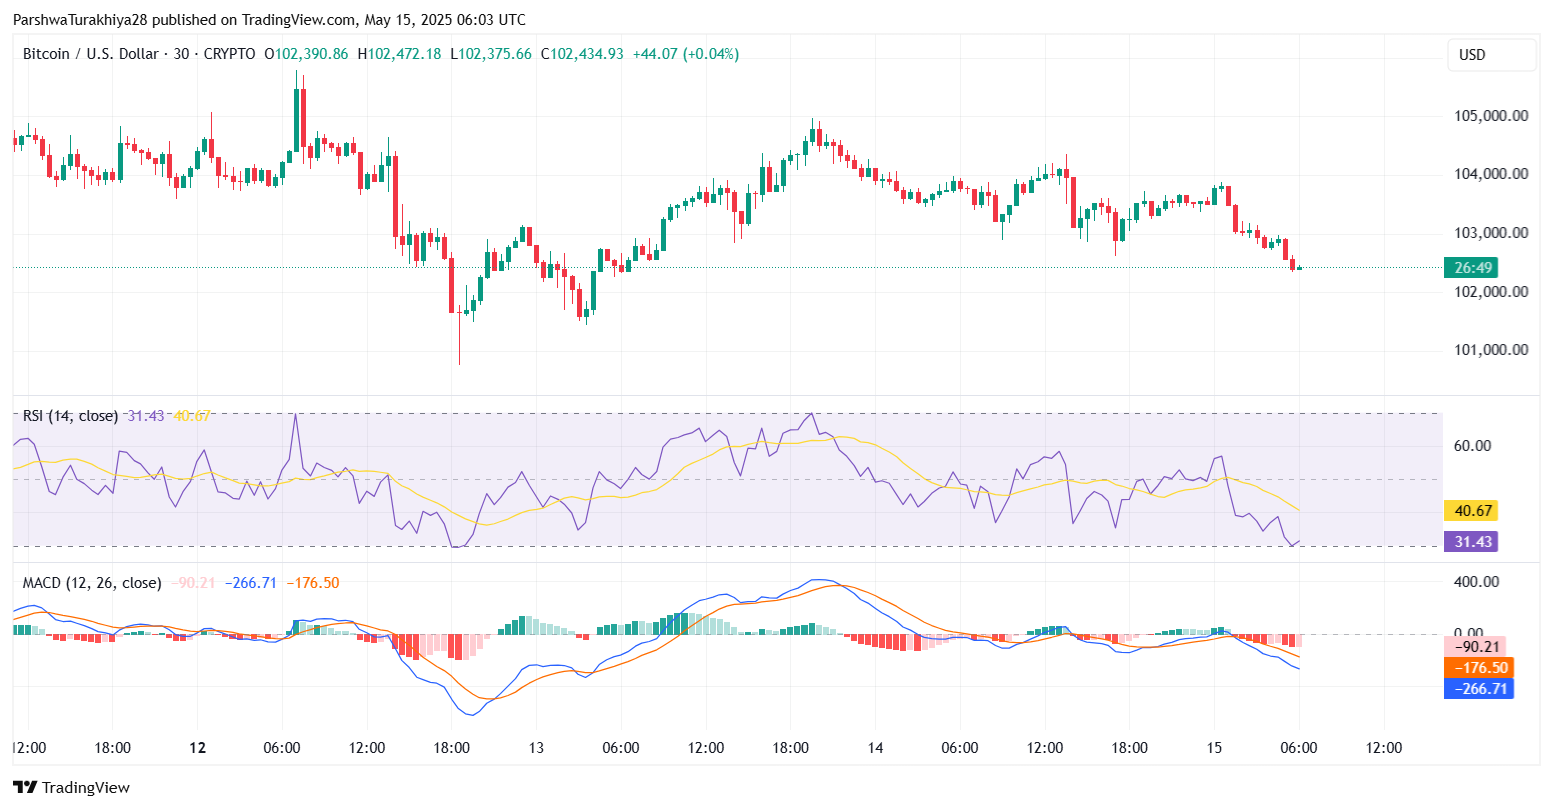
Looking at the 30-minute chart, BTC is slipping below the key short-term support at $102,800. The RSI sits at 31.4, entering oversold territory, while MACD has turned sharply negative with a widening histogram, suggesting short-term downside pressure.
 BTCUSD price dynamics (Source: TradingView)
A close below $102,000 could open a flush toward $100,800, which aligns with the lower trendline of the current 4-hour triangle. This level has acted as dynamic support since May 10 and remains pivotal for holding the structure.
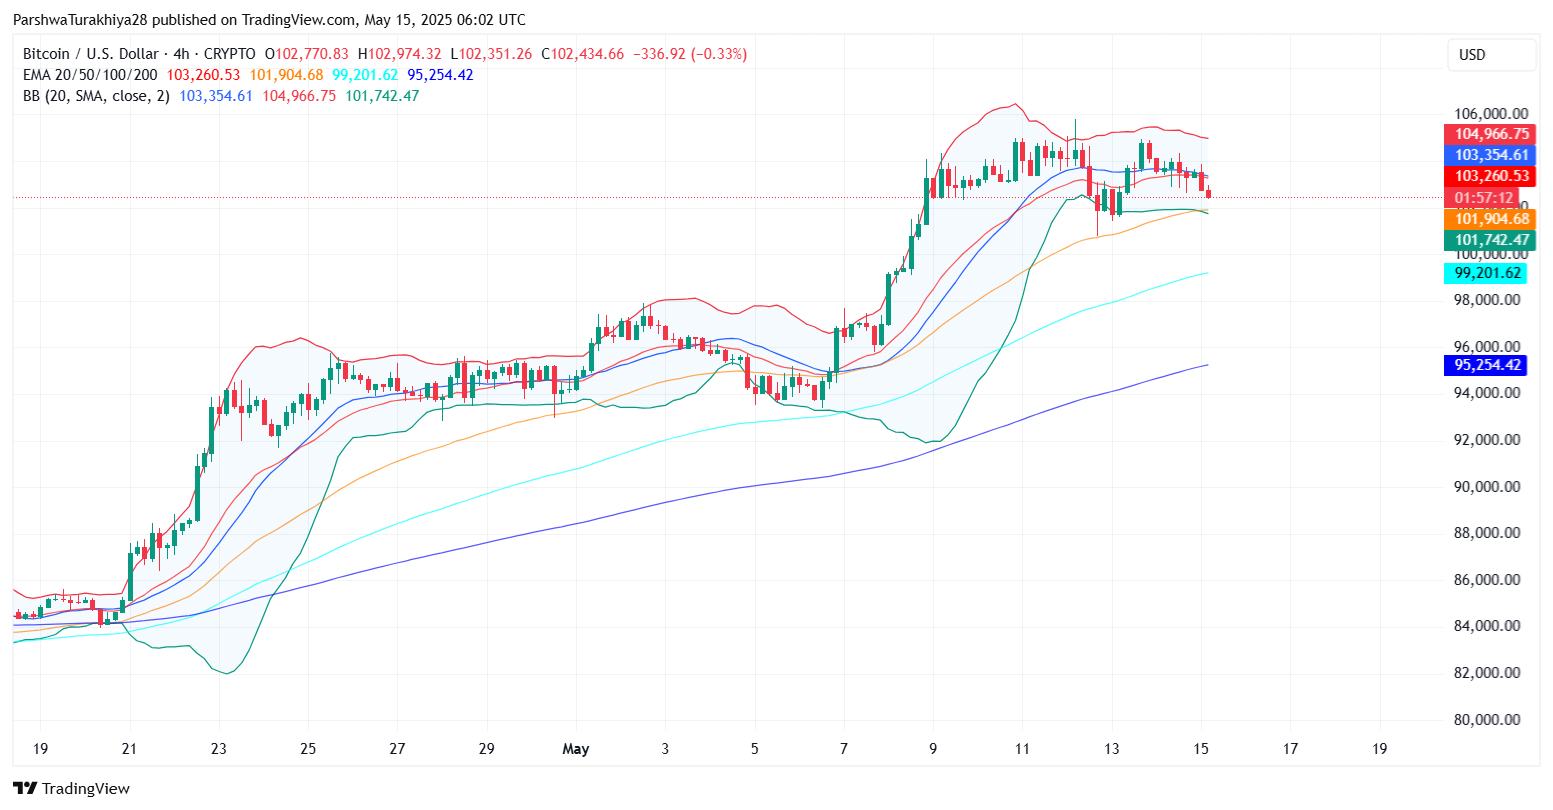
Bollinger Bands on the 4-hour chart are beginning to narrow, signaling reduced Bitcoin price volatility. Price is clinging to the lower Bollinger Band near $101,742, which increases the probability of a near-term rebound if buyers step in.
Why Bitcoin Price Going Down Today?
The latest Bitcoin price update reflects selling pressure after BTC failed to break through the upper resistance band at $105,000. The rejection from the high created a short-term bearish divergence on the RSI and a MACD crossover to the downside on the 30-minute chart.
 BTCUSD price dynamics (Source: TradingView)
Why Bitcoin price going down today can be attributed to this rejection and the exhaustion of the earlier bullish momentum. Until the $104,000–$105,500 zone is breached decisively, BTC could remain stuck in a short-term correction range.
Will Bitcoin Hold the $102K Support or Break Lower?
 BTCUSD price dynamics (Source: TradingView)
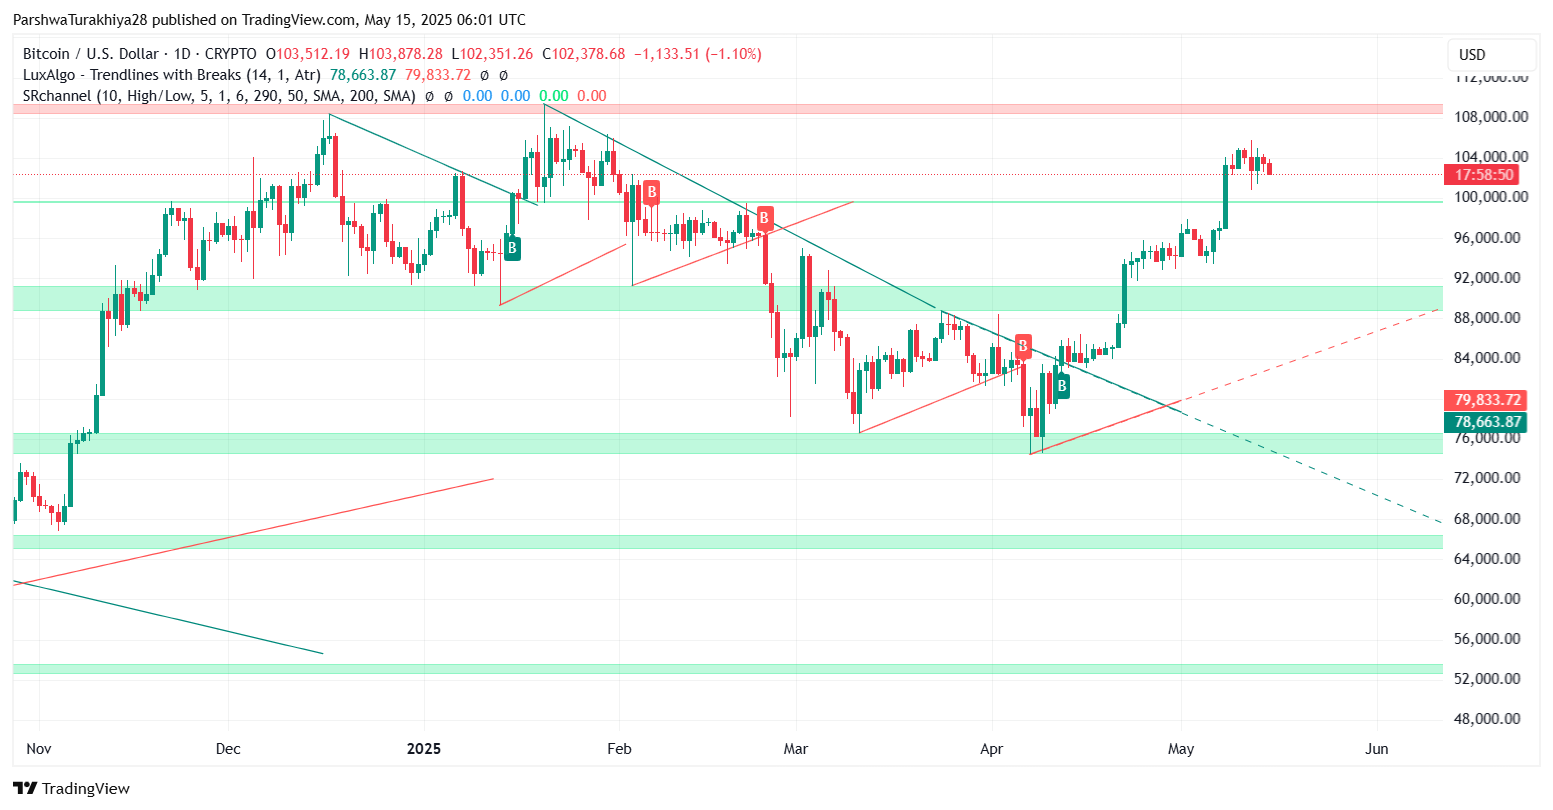
On the daily chart, BTC remains above its long-term trend breakout from April. The 20 EMA sits at $103,260, acting as immediate resistance. The 50 EMA below at $101,904 coincides with the key support band. As long as Bitcoin price remains above this dynamic zone, bulls have a fighting chance.
The weekly structure still favors buyers, but a failure to defend $100,800 may push BTC into a deeper correction toward $96,500–$98,000, which aligns with multiple Fibonacci retracements and horizontal support.
On the flip side, if BTC breaks back above $104,000 with volume, the $105,700 high could be retested, and a move toward $107,000 and the 1.0 Fibonacci extension becomes likely.
Bitcoin Price Forecast Table for May 16
| Indicator/Zone | Level (USD) | Signal |
| Resistance 1 | 104,000 | Near-term breakout zone |
| Resistance 2 | 105,700 | Post-rejection high |
| Support 1 | 102,000 | Short-term demand area |
| Support 2 | 100,800 | Critical trendline support |
| 50 EMA (4H) | 101,904 | Dynamic support zone |
| RSI (30-min) | 31.4 | Oversold |
| MACD (30-min) | Bearish | Momentum fading |
| Volatility Outlook | Contracting | Potential breakout ahead |
Disclaimer: The information presented in this article is for informational and educational purposes only. The article does not constitute financial advice or advice of any kind. Coin Edition is not responsible for any losses incurred as a result of the utilization of content, products, or services mentioned. Readers are advised to exercise caution before taking any action related to the company.

