Bitget App
Trade smarter
Buy cryptoMarketsTradeFuturesStocksEarnInstitutionAI & More
PEPE Price Momentum Slows as Sell Signal and Indicators Flag Caution

PEPE Price Momentum Slows as Sell Signal and Indicators Flag Caution

CoineditionCoinedition2025/05/15 16:00
By:Maxwell Mutuma
  • TD Sequential flashes sell signal as PEPE nears resistance at the 1.272 Fibonacci extension.
  • RSI drops to 68.82 from above 75, signaling reduced buying pressure near overbought levels.
  • MACD histogram contracts, suggesting waning momentum and risk of bearish crossover ahead.

Pepe (PEPE), the meme-based cryptocurrency, may enter a short-term phase after a strong rally in mid-April 2025. A combination of technical indicators and chart patterns now suggests a consolidation period or retracement.

The latest signal from the TD Sequential indicator, alongside changes in the Relative Strength Index (RSI) and Moving Average Convergence Divergence (MACD), points to declining bullish momentum after PEPE reached a recent local high.

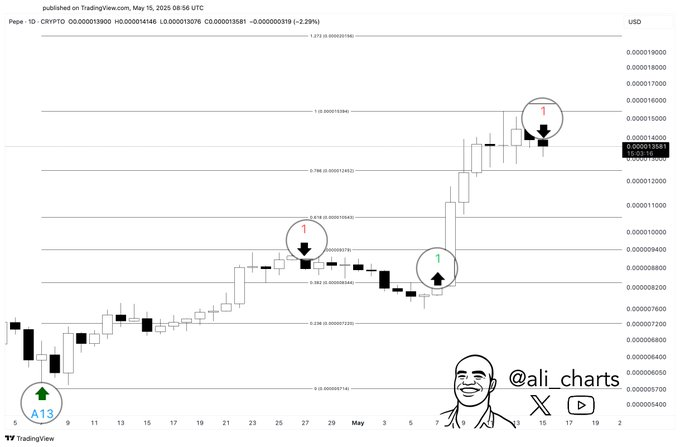
The TD Sequential has been spot-on with $PEPE daily chart. And it’s now flashing a sell signal, suggesting a potential pullback ahead. pic.twitter.com/3aTrPUHI4A

— Ali (@ali_charts) May 15, 2025

The daily chart reflects a structured advance from the $0.00000045 level in April, followed by a series of Fibonacci retracement moves. After hitting resistance at the 0.618 level around $0.00000103, PEPE pulled back before regaining strength.

This was confirmed by a bounce from the 0.382 support, which led to another breakout above the 1.0 Fibonacci extension near $0.00000134. The token later peaked at approximately $0.00000168 near the 1.272 extension, where current resistance has emerged, now marked by a new TD Sequential sell signal.
PEPE Price Momentum Slows as Sell Signal and Indicators Flag Caution image 0 PEPE Price Momentum Slows as Sell Signal and Indicators Flag Caution image 1 Source: X

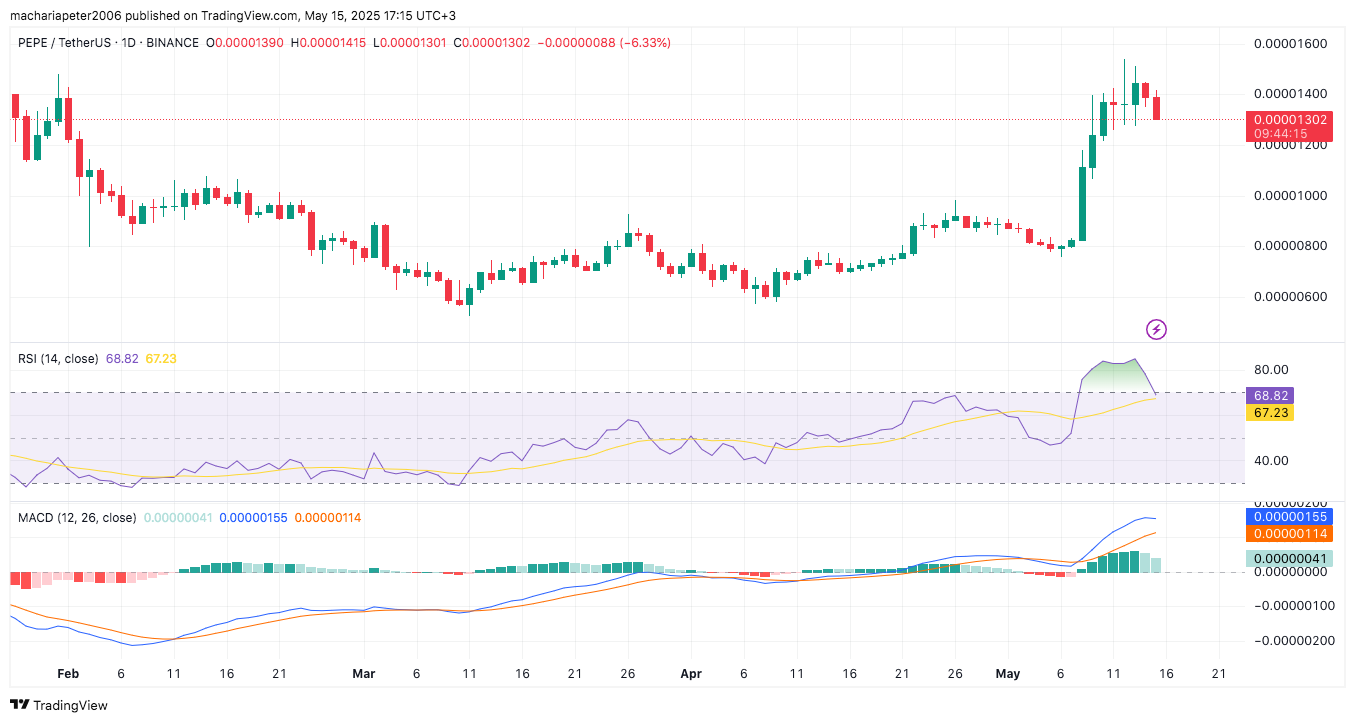
This technical setup is being echoed by momentum indicators. The RSI, which had previously surged above 75 during the rally, now reads 68.82, falling below the overbought zone of 70. The 14-day average RSI stands at 67.23, indicating signs of easing buying pressure. While these levels reflect bullish territory, the downward shift indicates that the strength behind PEPE’s upward move may be softening.

MACD Trend Remains Positive but Weakens

Further evidence of slowing momentum is visible on the MACD chart. Although the MACD line remains above the signal line, at 0.00000155 versus 0.00000114, the histogram bars have started to contract. This reduction in the histogram suggests weakening trend strength and raises the possibility of a bearish crossover if the MACD line dips below the signal line.
PEPE Price Momentum Slows as Sell Signal and Indicators Flag Caution image 2 PEPE Price Momentum Slows as Sell Signal and Indicators Flag Caution image 3 Source: TradingView


At the time of reporting, PEPE was trading at $0.000014 , reflecting a 1.78% decline over the past 24 hours. Its market capitalization stands at approximately $5.71 billion, ranking it 25th overall, with a 24-hour trading volume exceeding $1.16 billion.

Disclaimer: The information presented in this article is for informational and educational purposes only. The article does not constitute financial advice or advice of any kind. Coin Edition is not responsible for any losses incurred as a result of the utilization of content, products, or services mentioned. Readers are advised to exercise caution before taking any action related to the company.


1
0

Disclaimer: The content of this article solely reflects the author's opinion and does not represent the platform in any capacity. This article is not intended to serve as a reference for making investment decisions.

Understand the market, then trade.
Bitget offers one-stop trading for cryptocurrencies, stocks, and gold.
Trade now!

You may also like

The 10-year US Treasury yield approaches 5.4%, with the AI halo unable to hide the "inflated" risks of the S&P 500

Behind the S&P 500's record high, only 30% of its constituent stocks are above their 50-day moving average, marking the narrowest market breadth at a record high since 1990. The Russell 2000 has fallen for five consecutive weeks, and high-yield bond yields have soared to 15%. Societe Generale warns that if US Treasury yields rise to 6% and oil prices reach $150, the S&P 500 could fall by more than 20% next year. In addition, some top-performing fund managers have completely exited AI stocks in favor of energy, stating that once financing dries up, it will be "game over."

华尔街见闻•2026/10/10 04:01

Oil tanker freight reaches a sixty-year high: shipping oil from the US to China is more expensive than launching a rocket!

The freight for a single barrel of crude oil has soared to $41, approaching half the oil price, and for a single trip, the freight was once enough to buy an oil tanker. The Middle East crisis has led to a structural shortage of shipping capacity in the Strait of Hormuz, coupled with ship-to-ship transfers extending turnaround times. VLCC freight rates have skyrocketed from an annual average of $9.2 million to $77 million—an increase of more than eight times. Refiners’ profits are being rapidly eroded, the average price of second-hand oil tankers has reached a historic high, and, unusually, surpassed the price of new vessels.

华尔街见闻•2026/10/10 03:16
Oil tanker freight reaches a sixty-year high: shipping oil from the US to China is more expensive than launching a rocket!

Following the Drop but Not the Rise! Silver Trapped in Difficulties

The logic of AI and solar energy demand continues to play out, yet prices are falling against the trend—macroeconomic forces such as a strengthening US dollar and rising real interest rates have completely suppressed fundamentals. Speculative funds offloaded $1.6 billion in a single week, marking a yearly peak, while CTA net short positions reversed by $2.6 billion to the highest level this year. However, Goldman Sachs analysts believe that the extreme short positioning itself is building reversal momentum, highlighting an asymmetry; once macro headwinds subside, a retaliatory rebound could be easily triggered. After a similar shakeout last time, silver surged 15% in six weeks.

华尔街见闻•2026/10/10 02:21