
BNB Price Prediction: $720 Next or $600 First?

Binance Coin (BNB) price has been holding ground above the $640 level for several sessions, but the recent price action shows signs of fatigue. Based on the latest TradingView hourly and daily charts, BNB price is currently consolidating after a sharp rally, with critical technical levels suggesting a decision point is approaching.
BNB Price Prediction: Is BNB Losing Momentum or Just Consolidating?
 BNB/USD 1 Hr Chart- TradingView
On the hourly chart, BNB/USD is trading at $640.2 , showing minimal movement (+0.02%) as of the last candle. The price is hovering just below a key resistance cluster around $646–$652, formed by the 50, 100, and 200 simple moving averages. Notably, the 20 SMA ($642.6) and 50 SMA ($642.9) are nearly flat, indicating indecision in the short term.
We can clearly see a bearish crossover, where shorter moving averages have failed to climb above the longer ones. This typically signals selling pressure. The Heikin Ashi candles are showing small-bodied formations with wicks on both ends, reinforcing the narrative of sideways chop and lack of trend.
Using a Fibonacci retracement from the recent hourly high of $660 to the low near $620, we can estimate:
- 23.6% Fib: ~$630
- 50% Fib: ~$640
- 61.8% Fib: ~$646
BNB price is now sitting right at the 50% Fibonacci level , suggesting this zone could act as a pivot — a break above could re-ignite a bullish move, but rejection may send BNB retesting support near $620.
What Does the Daily Chart Say About the Bigger Picture?
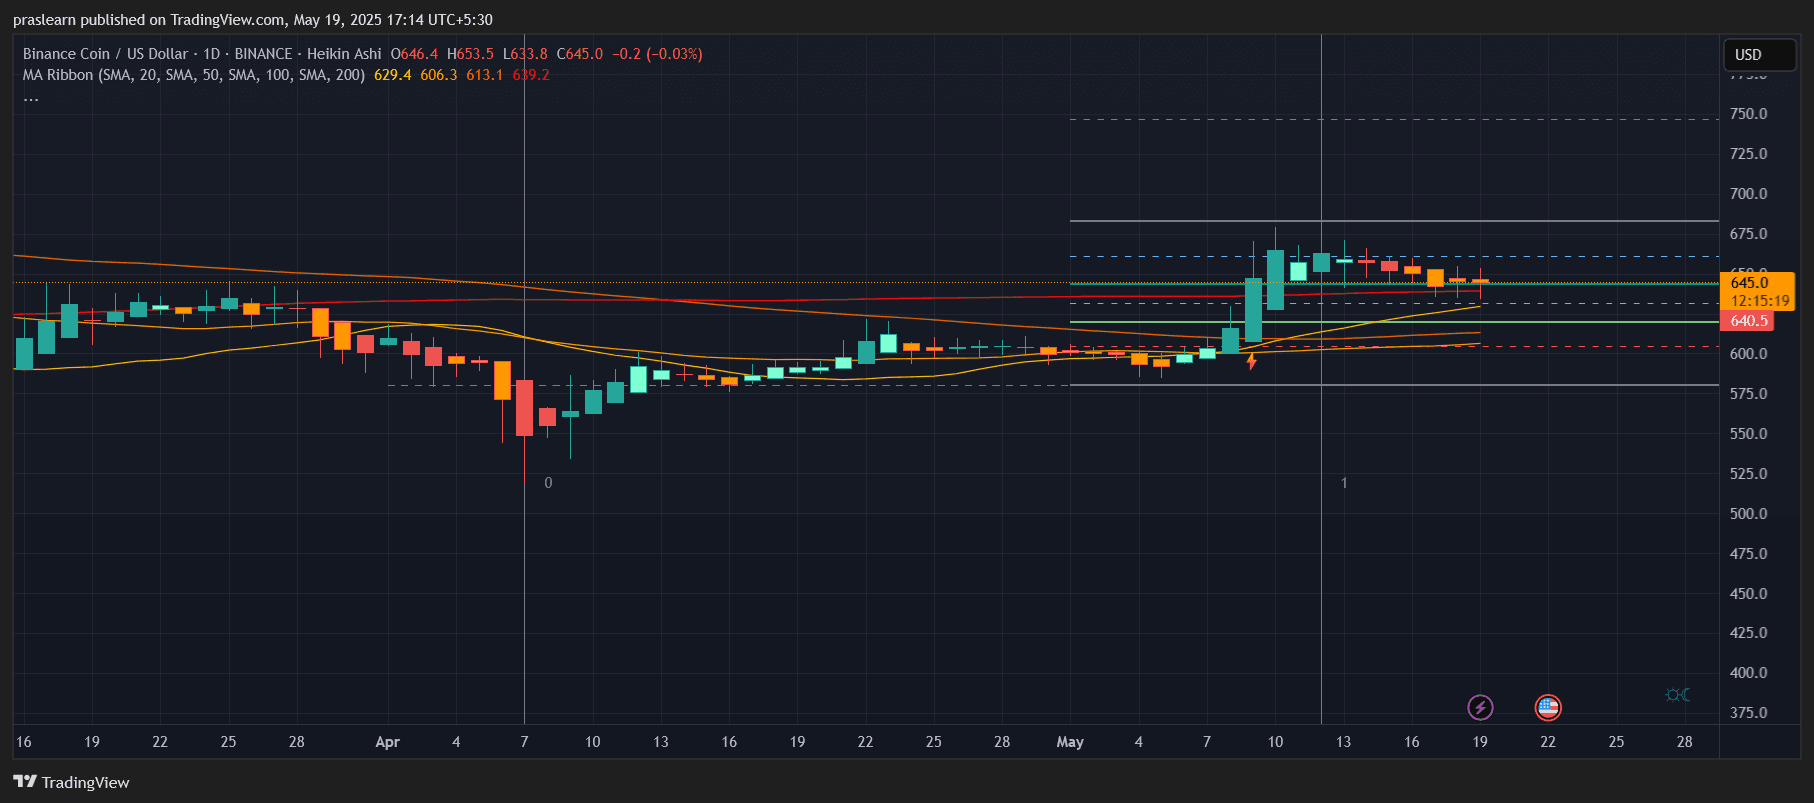 BNB/USD 1 Day Chart- TradingView
Zooming out, the daily chart paints a more optimistic picture, but it's not without red flags. BNB price is still trading above all key daily moving averages:
- 20 SMA: $629.4
- 50 SMA: $606.3
- 100 SMA: $613.1
- 200 SMA: $619.2
This alignment of the short-term SMA > long-term SMA is a classic bullish structure. However, the price action is stalling near $645–$650 — an area that coincides with the 0.382 Fibonacci retracement from the March high to the April low. The local top of $660 formed earlier this week has not yet been breached, and the last few candles are showing signs of weakening momentum with lower highs and smaller bodies.
If this is a bull flag pattern, which it appears to be, we can estimate the breakout target using flagpole projection:
- Flagpole height: $660 (high) - $580 (breakout base) = $80
- Projected target from breakout: $640 + $80 = $720
This gives a bullish breakout target of $720, but only if Binance Coin price can decisively close above $660 with strong volume.
BNB Price Prediction: Can BNB Reclaim $700?
To answer this, let’s combine momentum and price structure:
- RSI (not shown on chart but inferred from consolidation) is likely neutral, which means Binance coin price has room to move in either direction.
- The long-term trend is still intact, but BNB needs to defend the $640–$620 support zone strongly to avoid slipping into a bearish correction.
- The bearish hourly pressure contradicts the bullish daily setup, creating a classic breakout vs breakdown tension.
So, if $640 fails, the next daily support lies at $620, and below that, the 100-day SMA near $613. On the flip side, a move above $660 would open up room for $700 and then $720, based on the flagpole calculation.
Final Thoughts: What's the Trade?
BNB price sideways action is a cool-off phase after a strong May rally. Right now, it’s a battle between short-term bearish pullbacks and long-term bullish trend continuation. The market is waiting for a trigger — likely Bitcoin’s next move or macro news — to decide the direction.
For traders, $660 is the breakout level to watch, and $620 is the key support. The next 48 hours will be critical in determining if BNB heads toward $700 or dips back to $600.
Binance Coin (BNB) price has been holding ground above the $640 level for several sessions, but the recent price action shows signs of fatigue. Based on the latest TradingView hourly and daily charts, BNB price is currently consolidating after a sharp rally, with critical technical levels suggesting a decision point is approaching.
BNB Price Prediction: Is BNB Losing Momentum or Just Consolidating?
BNB/USD 1 Hr Chart- TradingView
On the hourly chart, BNB/USD is trading at $640.2 , showing minimal movement (+0.02%) as of the last candle. The price is hovering just below a key resistance cluster around $646–$652, formed by the 50, 100, and 200 simple moving averages. Notably, the 20 SMA ($642.6) and 50 SMA ($642.9) are nearly flat, indicating indecision in the short term.
We can clearly see a bearish crossover, where shorter moving averages have failed to climb above the longer ones. This typically signals selling pressure. The Heikin Ashi candles are showing small-bodied formations with wicks on both ends, reinforcing the narrative of sideways chop and lack of trend.
Using a Fibonacci retracement from the recent hourly high of $660 to the low near $620, we can estimate:
- 23.6% Fib: ~$630
- 50% Fib: ~$640
- 61.8% Fib: ~$646
BNB price is now sitting right at the 50% Fibonacci level , suggesting this zone could act as a pivot — a break above could re-ignite a bullish move, but rejection may send BNB retesting support near $620.
What Does the Daily Chart Say About the Bigger Picture?
BNB/USD 1 Day Chart- TradingView
Zooming out, the daily chart paints a more optimistic picture, but it's not without red flags. BNB price is still trading above all key daily moving averages:
- 20 SMA: $629.4
- 50 SMA: $606.3
- 100 SMA: $613.1
- 200 SMA: $619.2
This alignment of the short-term SMA > long-term SMA is a classic bullish structure. However, the price action is stalling near $645–$650 — an area that coincides with the 0.382 Fibonacci retracement from the March high to the April low. The local top of $660 formed earlier this week has not yet been breached, and the last few candles are showing signs of weakening momentum with lower highs and smaller bodies.
If this is a bull flag pattern, which it appears to be, we can estimate the breakout target using flagpole projection:
- Flagpole height: $660 (high) - $580 (breakout base) = $80
- Projected target from breakout: $640 + $80 = $720
This gives a bullish breakout target of $720, but only if Binance Coin price can decisively close above $660 with strong volume.
BNB Price Prediction: Can BNB Reclaim $700?
To answer this, let’s combine momentum and price structure:
- RSI (not shown on chart but inferred from consolidation) is likely neutral, which means Binance coin price has room to move in either direction.
- The long-term trend is still intact, but BNB needs to defend the $640–$620 support zone strongly to avoid slipping into a bearish correction.
- The bearish hourly pressure contradicts the bullish daily setup, creating a classic breakout vs breakdown tension.
So, if $640 fails, the next daily support lies at $620, and below that, the 100-day SMA near $613. On the flip side, a move above $660 would open up room for $700 and then $720, based on the flagpole calculation.
Final Thoughts: What's the Trade?
BNB price sideways action is a cool-off phase after a strong May rally. Right now, it’s a battle between short-term bearish pullbacks and long-term bullish trend continuation. The market is waiting for a trigger — likely Bitcoin’s next move or macro news — to decide the direction.
For traders, $660 is the breakout level to watch, and $620 is the key support. The next 48 hours will be critical in determining if BNB heads toward $700 or dips back to $600.
Disclaimer: The content of this article solely reflects the author's opinion and does not represent the platform in any capacity. This article is not intended to serve as a reference for making investment decisions.
You may also like
CandyBomb x RAVE: Trade futures to share 200,000 RAVE!
Bitget TradFi: Trade gold, forex, and more assets in one account
CandyBomb x US: Trade to share 5,400,000 US
[Initial Listing] Bitget to list Almanak (ALMANAK). Grab a share of 4,200,000 ALMANAK