Key Insights:
- Solana price tested the $174–$188 resistance zone three times since 2024, rejecting each time.
- SOL futures trading volume remains steady at $6.5B despite a 10% price drop.
- Solana corrected nearly 10% after failing to break above the $185 resistance level.
Solana (SOL) has remained stable during the recent drop in the broader cryptocurrency market. While other major digital assets fell, SOL stayed above $160, showing continued buying interest. Market data and trading activity in futures suggest that if the price moves past $200, it could start a new upward trend soon.
Solana Price Resistance Levels Hold Key to Breakout
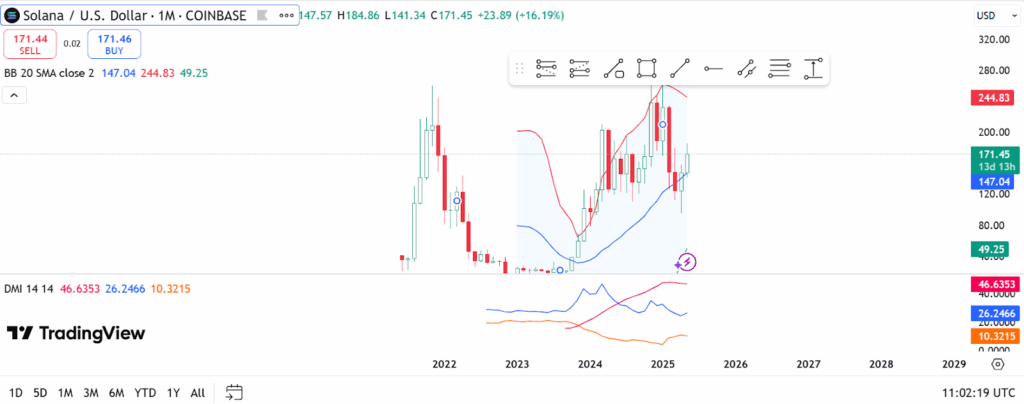
Solana’s price has remained within a tight range of $165 to $175 after reaching $185 last week. Prices between $174 and $188 are meeting strong resistance. This price peak has been observed several times in the last year.
The data points from history indicate that during May to August 2024, this range acted as a barrier. Later on, it served as a support level between December 2024 and January 2025. In May 2025, Solana’s attempts in this area were again not welcomed, dropping by 10% from its peak value.
 Source: TradingView
Analysts claim this keeps reoccurring because of the importance of the range between $174 and $188. Many traders are observing the market, as a clear breakout or rejection might signal the upcoming direction of the price. If the current level is surpassed, the price might move higher, but if this is rejected, a drop back to areas of previous support is possible.
On-Chain Metrics Show Resilience
Despite the fall in price, the volume of Solana trading futures has been steady. The site Coinglass published daily volumes of $6.5 billion. During the past 24 hours, $12 million of futures positions were liquidated and $11 million was from short positions. This means that several traders expected the price to decrease and they lost their bets since the price stayed higher than $160.
 Source: CoinGlass
Additionally, liquidation charts show a pattern of long liquidations during the sharp drop in early May. Liquidations exceeding $18 million were seen between May 9 and May 13, as the price dropped from $180 to below $140.
However, once the price started to climb, the amount of short liquidations went up. It indicates that the market is responding to recent volatility by pushing out all kinds of leverage from both parties.
Growth in Ecosystem Supports Long-Term Outlook
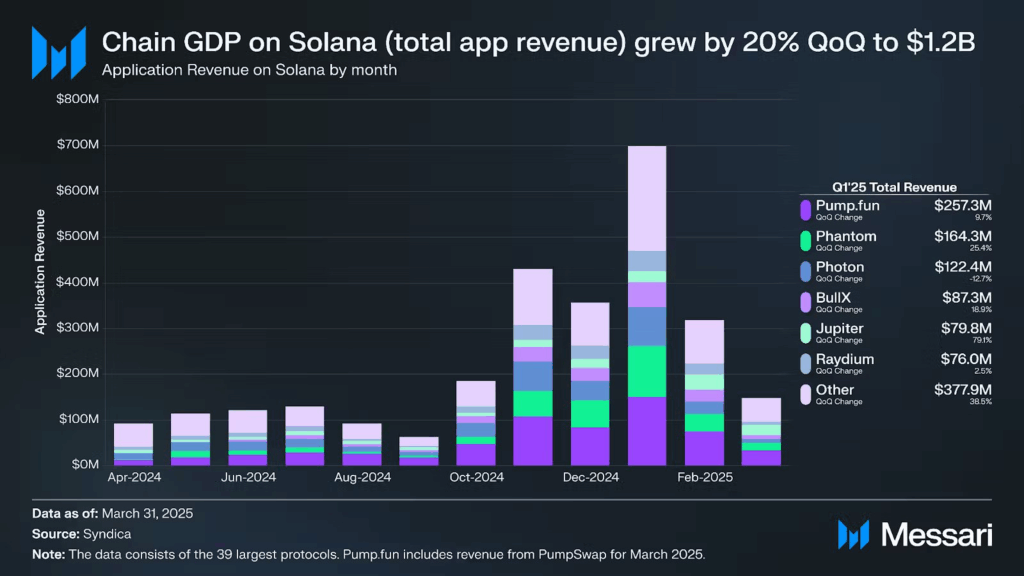
According to Messari’s Q1 2025 “State of Solana” report, Solana’s blockchain recorded a 20% rise in its blockchain GDP, reaching $1.2 billion. Stablecoins on Solana saw their total market capitalization rise by 145% to $12.5 billion. The data demonstrates that blockchain growth is not slowing despite the uncertain state of the market.
The DEX activity on Solana also increased significantly. In Q1, DEX spot trading volume jumped by 40.8%, reaching nearly $4.6 billion daily. This suggests that more people and developers are interested in DeFi on the network.
 Source: Messari
The report by Messari pointed out that there have been advances in the framework used by Solana. It was proven that progress in the field makes the network both dependable and productive for use.Improvements and greater activity on Solana indicate the ecosystem is moving ahead and expanding into further growth.
Breakout Above Resistance May Signal Next Solana Price Move
Several analysts are keeping a close watch on the $200 resistance level. Crypto Spaces commented, “Once Solana crosses the $200 level, the next target could quickly shift to $350.” This view is echoed by other market participants who are tracking short-term technical patterns and liquidation data to identify possible entry points.
Ali Chart, a technical chartist, identified the $174–$188 range as a “critical resistance zone.” He stated that if the price can break and close above $188 with volume, it may continue toward $200 and beyond. On the downside, support levels at $155, $140, and $120 could come into play if the current resistance holds firm.
According to the data, significant changes in liquidations and volume levels coincide with heightened usage of leverage. Positions held by traders have been sold off as they were unable to push costs much higher. With leverage decreasing and futures trading about the same, the market could soon determine the next price direction.