Bitget App
Trade smarter
Buy cryptoMarketsTradeFuturesEarnWeb3SquareMore
Trade
Spot
Buy and sell crypto with ease
Margin
Amplify your capital and maximize fund efficiency
Onchain
Going Onchain, without going Onchain!
Convert & block trade
Convert crypto with one click and zero fees
Explore
Launchhub
Gain the edge early and start winning
Copy
Copy elite trader with one click
Bots
Simple, fast, and reliable AI trading bot
Trade
USDT-M Futures
Futures settled in USDT
USDC-M Futures
Futures settled in USDC
Coin-M Futures
Futures settled in cryptocurrencies
Explore
Futures guide
A beginner-to-advanced journey in futures trading
Futures promotions
Generous rewards await
Overview
A variety of products to grow your assets
Simple Earn
Deposit and withdraw anytime to earn flexible returns with zero risk
On-chain Earn
Earn profits daily without risking principal
Structured Earn
Robust financial innovation to navigate market swings
VIP and Wealth Management
Premium services for smart wealth management
Loans
Flexible borrowing with high fund security
Official Melania Meme (MELANIA) To Make Rebound? Key Harmonic Pattern Signals Potential Upside Move

Official Melania Meme (MELANIA) To Make Rebound? Key Harmonic Pattern Signals Potential Upside Move

CoinsProbeCoinsProbe2025/05/21 00:08
By:Nilesh Hembade

Date: Tue, May 20, 2025 | 03:35 PM GMT

After a rough start to 2025 — where even Ethereum (ETH) crashed 45% in Q1 — the crypto market is finally seeing a solid recovery. ETH has surged by 58% over the last 30 days, triggering a broader bullish wave across major memecoins.

Yet, Official Melania Meme (MELANIA) has been lagging. The token remains down by 98 for the month and still trades nearly 97% below its all-time high (ATH). But there’s a glimmer of hope: a key harmonic pattern forming on the charts suggests a potential bullish reversal may be just around the corner.

Official Melania Meme (MELANIA) To Make Rebound? Key Harmonic Pattern Signals Potential Upside Move image 0 
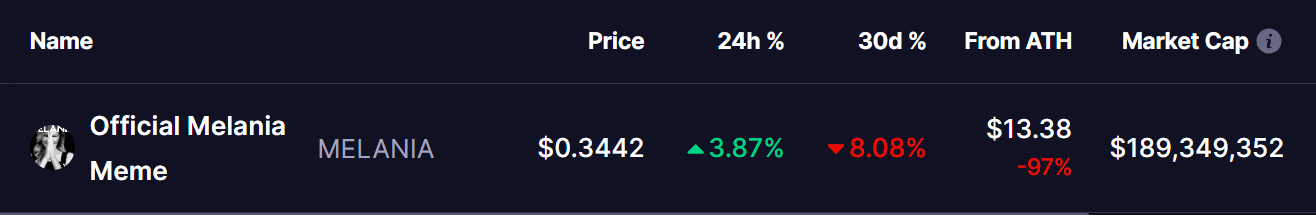
Source: Coinmarketcap

Harmonic Pattern Signals More Upside

On the daily timeframe, MELANIA is forming a Bearish Butterfly harmonic pattern — a setup that often hints at trend reversals once the final leg (CD) completes. Until then, the pattern typically pushes the asset higher with building momentum.

The formation started on April 26, when MELANIA got rejected near $0.575 (point X). It then dropped roughly 45%, bottoming out at $0.31 (point A) on May 19.

Official Melania Meme (MELANIA) To Make Rebound? Key Harmonic Pattern Signals Potential Upside Move image 1 MELANIA Daily Chart/Coinsprobe (Source: Tradingview)

From there, the token reversed and began constructing its BC and CD legs. The C point is locked near $0.31, and price is now rising steadily to complete the D leg, currently trading around $0.3440.

According to the harmonic structure, the potential reversal zone (point D) lies near the 1.272 Fibonacci extension of the XA leg — approximately $0.6452. If this plays out, MELANIA could rally by nearly 87% from current levels.

What’s Next for MELANIA?

Before it gets to the D point, MELANIA needs to break above key resistance at $0.5197 — the 0.786 Fibonacci retracement level. A clean breakout above this zone could trigger a run toward $0.6452, the pattern’s ideal target. If bullish momentum continues, the price may even test the 1.618 extension level near $0.7347, depending on how MELANIA reacts at the D zone.

Meanwhile, the only lingering concern is the price movement of Ethereum (ETH), which remains a key driver for sentiment across the memecoin market.

Disclaimer: This article is for informational purposes only and not financial advice. Always conduct your own research before investing in cryptocurrencies.

0

Disclaimer: The content of this article solely reflects the author's opinion and does not represent the platform in any capacity. This article is not intended to serve as a reference for making investment decisions.

PoolX: Earn new token airdrops
Lock your assets and earn 10%+ APR
Lock now!

You may also like

New spot margin trading pair — HOLO/USDT!

Bitget Announcement2025/09/12 07:46

FUN drops by 32.34% within 24 hours as it faces a steep short-term downturn

- FUN plunged 32.34% in 24 hours to $0.008938, marking a 541.8% monthly loss amid prolonged bearish trends. - Technical breakdowns, elevated selling pressure, and forced liquidations highlight deteriorating market sentiment and risk-off behavior. - Analysts identify key support below $0.0080 as critical, with bearish momentum confirmed by RSI (<30) and MACD indicators. - A trend-following backtest strategy proposes short positions based on technical signals to capitalize on extended downward trajectories.

Bitget-RWA2025/09/12 06:14
FUN drops by 32.34% within 24 hours as it faces a steep short-term downturn

OPEN has dropped by 189.51% within 24 hours during a significant market pullback

- OPEN's price plummeted 189.51% in 24 hours to $0.8907, marking its largest intraday decline in history. - The token fell 3793.63% over 7 days, matching identical monthly and yearly declines, signaling severe bearish momentum. - Technical analysts cite broken support levels and lack of bullish catalysts as key drivers of the sustained sell-off. - Absence of stabilizing volume or reversal patterns leaves the market vulnerable to further downward pressure.

Bitget-RWA2025/09/12 06:14
OPEN has dropped by 189.51% within 24 hours during a significant market pullback

New spot margin trading pair — LINEA/USDT!

Bitget Announcement2025/09/11 10:04