

After posting an explosive rally in early May, PEPE price today is trading around $0.00001354, attempting to consolidate above key short-term support levels. The memecoin recently surged from under $0.000009 to $0.00001466 before stalling just beneath a major resistance zone. With bullish momentum fading slightly, traders are now focused on whether PEPE can hold its higher range or if another pullback is in play.
Highlights
- PEPE price is trading near $0.00001354, struggling to breach the resistance zone at $0.000014–$0.00001466.
- RSI and MACD show early signs of weakening momentum despite recent PEPE price spikes.
- Rising trendline support and tight consolidation suggest a breakout or breakdown could be imminent.
What’s Happening With PEPE’s Price?
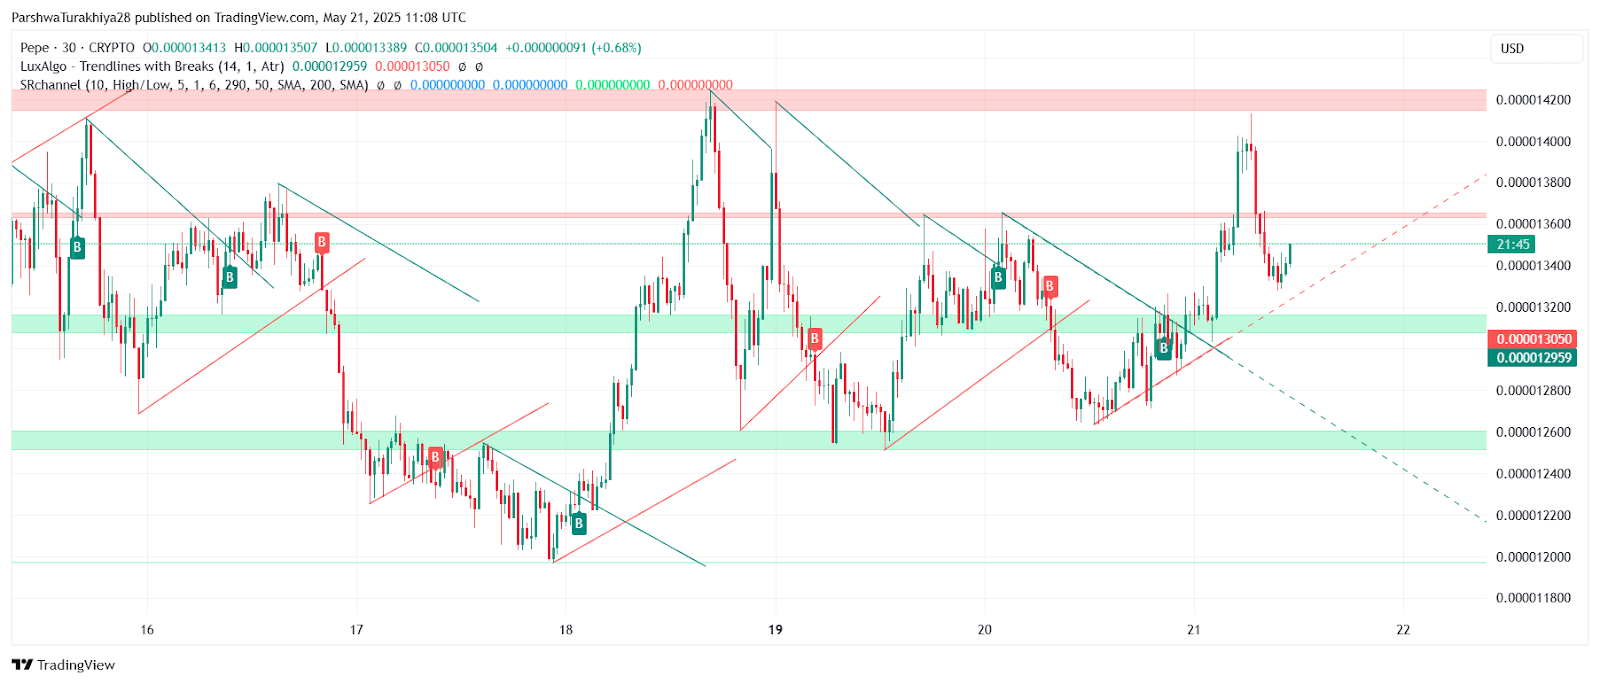
 PEPE price dynamics (Source: TradingView)
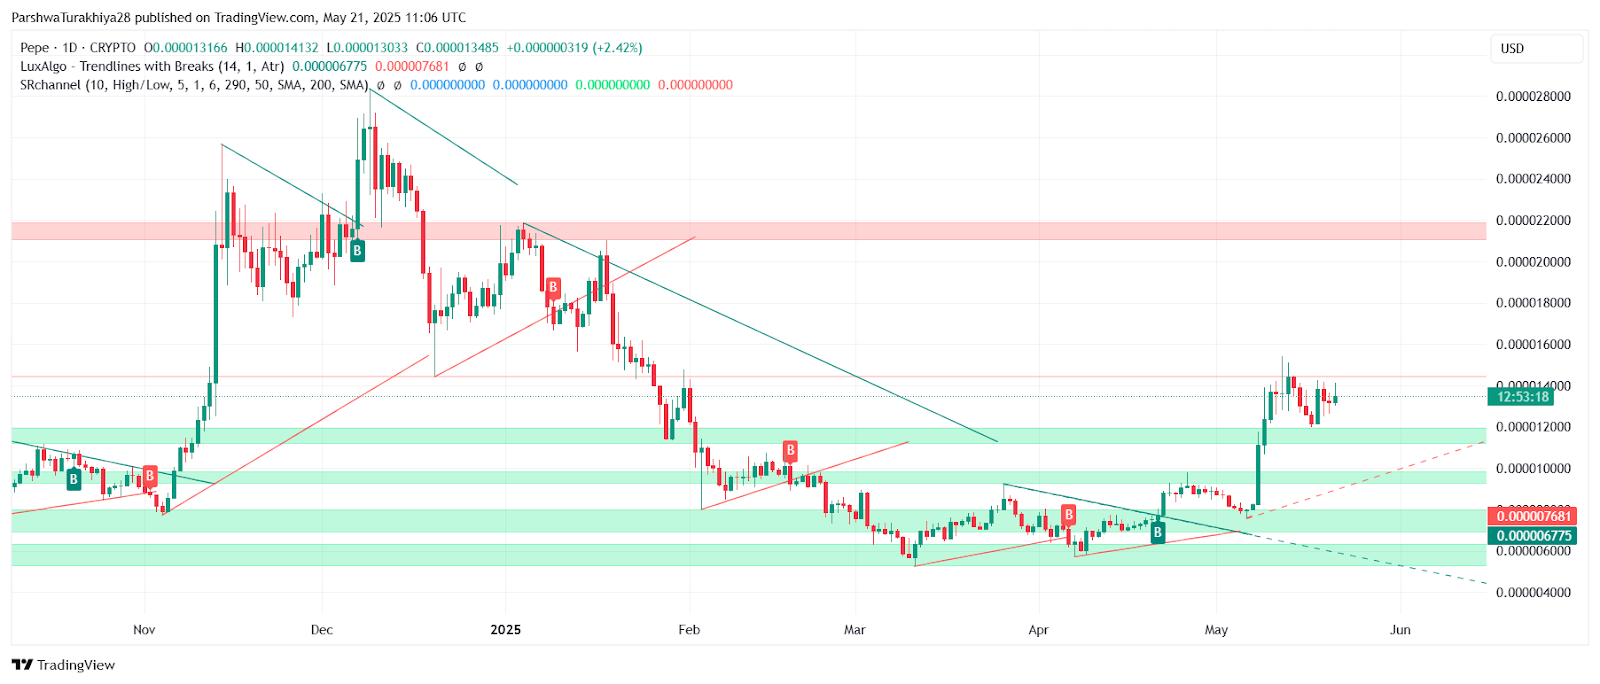
After weeks of steady accumulation, PEPE price action turned vertical between May 9 and 13, with price exploding from $0.00000895 to $0.00001466. This marked a 60%+ rally that sent traders flocking back into the memecoin. However, since hitting local highs, PEPE has failed to produce new momentum highs, forming a tight range below $0.00001450.
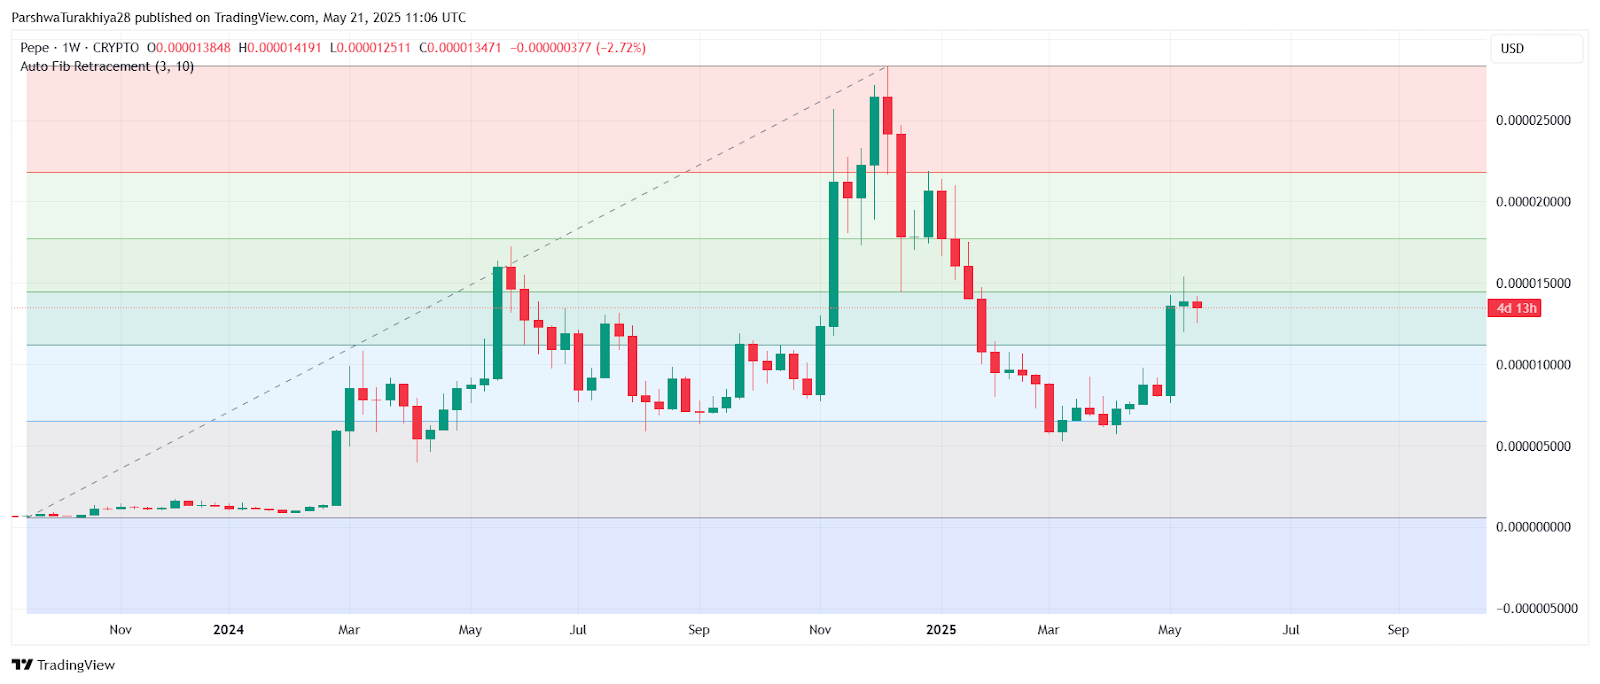
The daily chart shows price consolidating within a horizontal band, supported by the green zone near $0.00001250 and capped by resistance at $0.00001466. This level also aligns with the 38.2% Fibonacci retracement from the November 2023 top to the March 2025 bottom, reinforcing its significance.
The ascending trendline from early May lows remains intact, with price continuing to respect higher lows on the 4-hour and 30-minute charts.
RSI and MACD Suggest Fading Bullish Pressure
 PEPE price dynamics (Source: TradingView)
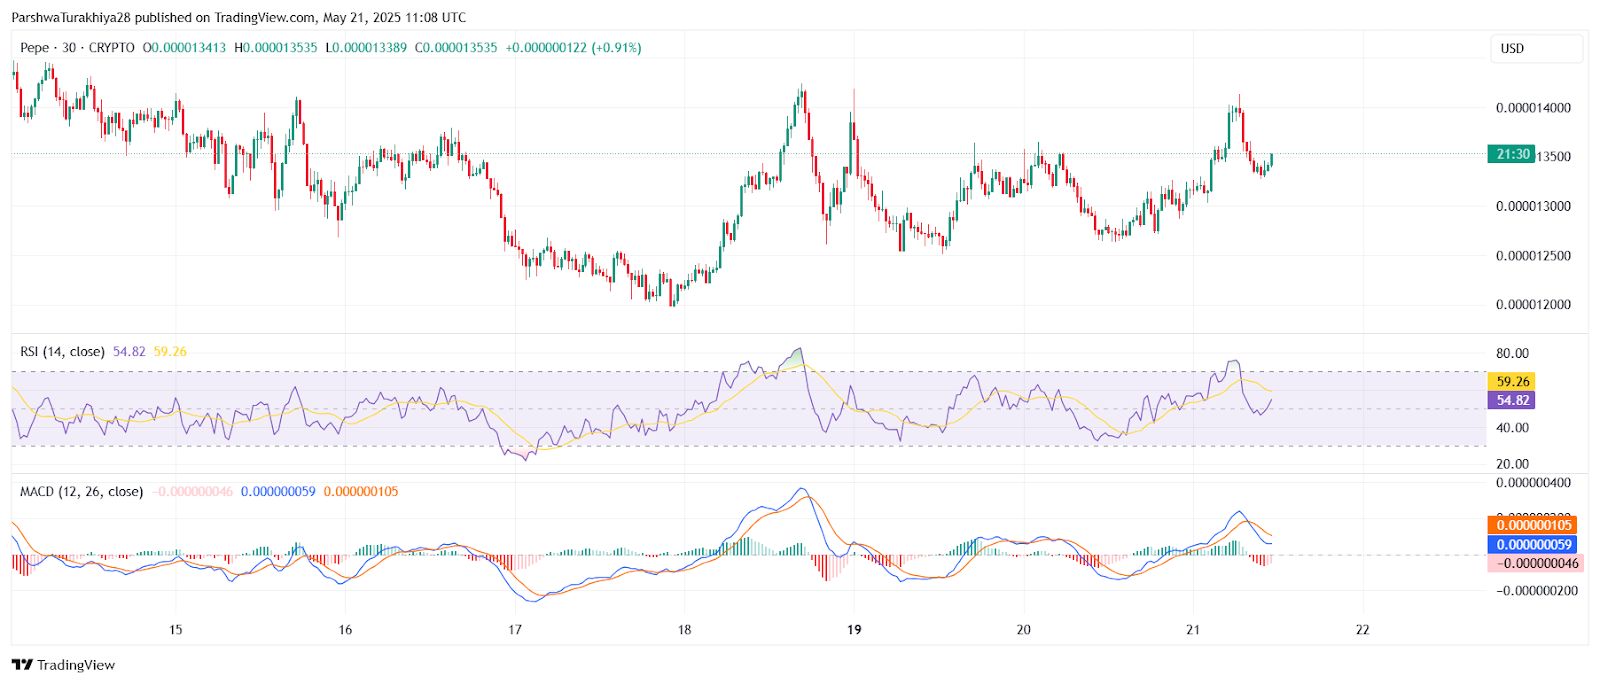
Momentum indicators are beginning to reflect fatigue following the earlier PEPE price spikes. On the 30-minute chart, RSI has dropped from overbought territory near 70 to 54.8, while the MACD histogram is flattening, with a bearish crossover visible.
 PEPE price dynamics (Source: TradingView)
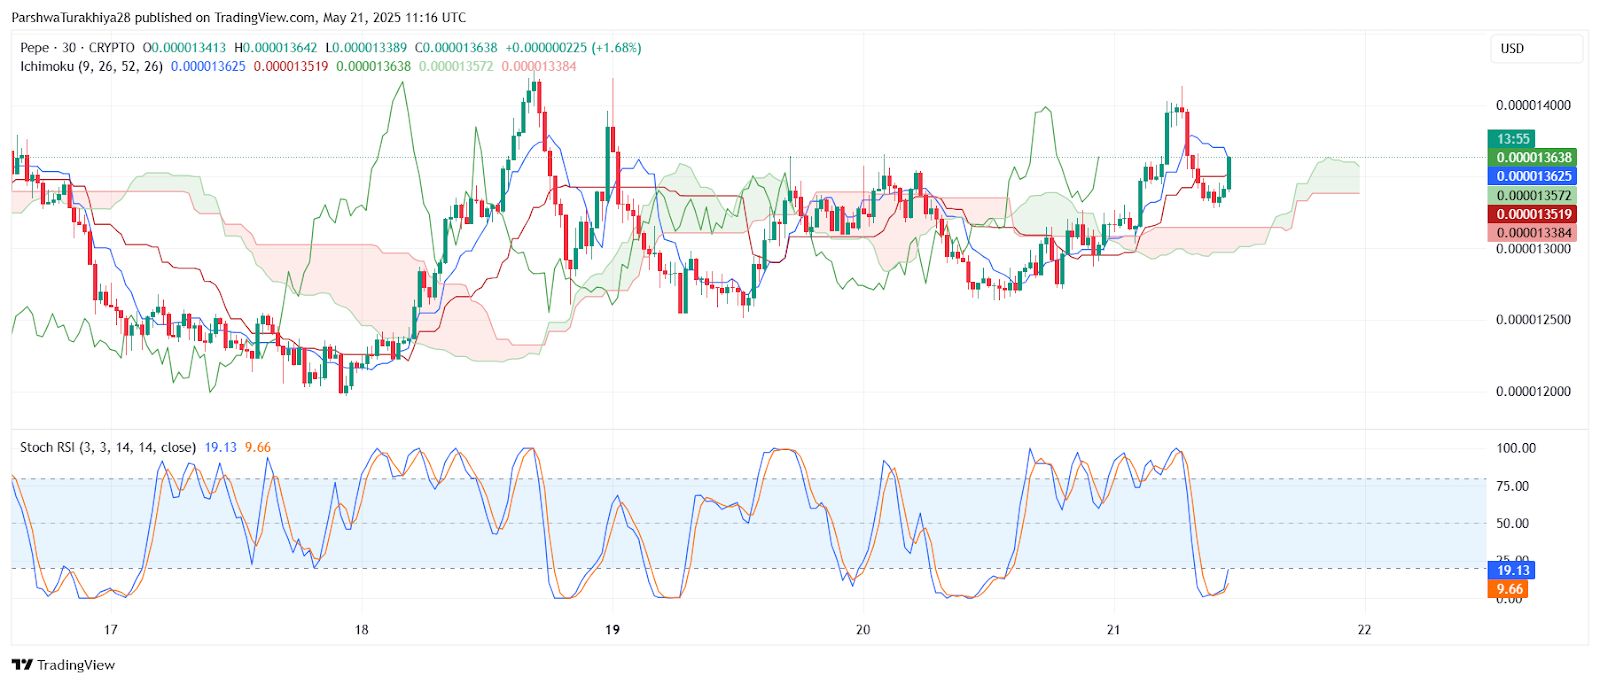
The Stochastic RSI also paints a near-term corrective picture, with both %K and %D lines falling under 20, hinting at oversold conditions—but with no bullish crossover yet confirmed.
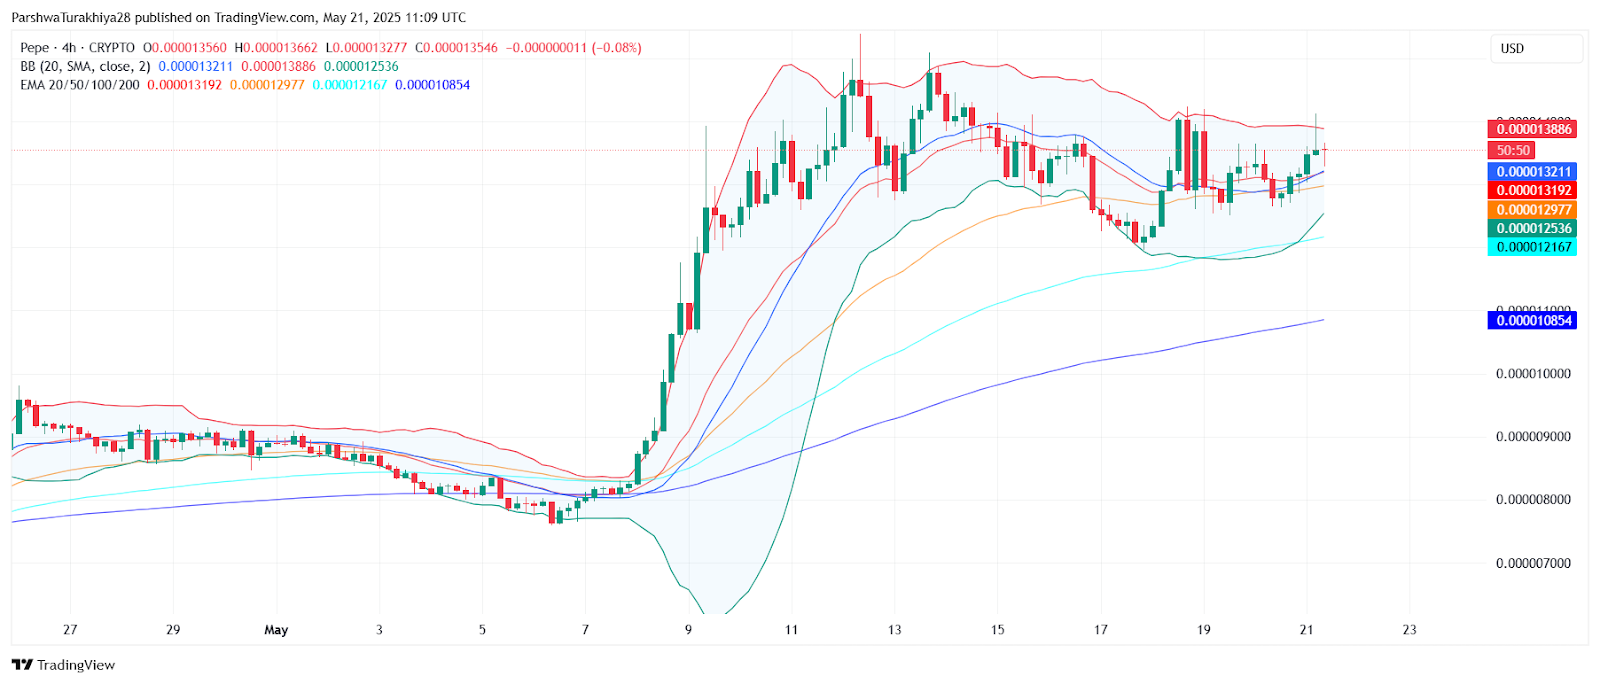
On the 4-hour chart, RSI has declined to the neutral 50–55 band, while MACD remains positive but narrowing, suggesting a possible pause or pullback before the next leg. This supports a cautious stance unless the bulls can generate fresh volume above $0.000014.
Why PEPE Price Going Down Today? Resistance Zone Still Intact
Despite the impressive breakout earlier this month, PEPE price today remains capped beneath a thick resistance band between $0.00001400 and $0.00001466. This region corresponds with both historical supply (from the November-December 2023 rallies) and Fibonacci confluence zones.
 PEPE price dynamics (Source: TradingView)
The inability to close above this level over the last four daily sessions indicates strong seller interest and potential exhaustion of short-term bulls. Volume has also steadily declined since May 13, adding to the hesitation.
Additionally, Bollinger Bands on the 4-hour chart have started to contract, and price is moving sideways near the midline—often a precursor to lower volatility phases or mini-corrections.
Short-Term Forecast: Can PEPE Reclaim $0.000014?
 PEPE price dynamics (Source: TradingView)
The short-term outlook for PEPE price hinges on whether it can defend the rising trendline and horizontal support near $0.00001295. As long as price holds above this level, the structure remains bullish with a potential for breakout toward $0.00001560 and beyond.
However, if sellers push PEPE price below $0.00001295 on rising volume, a retest of the $0.00001180–$0.00001220 zone becomes likely. This would also invalidate the current ascending wedge structure forming on the intraday charts.
 PEPE price dynamics (Source: TradingView)
Traders should watch for confirmation above $0.00001388, where Bollinger Band resistance and EMA cluster resistance coincide. A clean breakout could trigger another wave toward $0.000015 and potentially $0.00001684—the 50% Fibonacci retracement level.
Until then, the sideways PEPE price action and weakening indicators suggest consolidation may persist.
PEPE Price Forecast Table
| Indicator/Zone | Level (USD) | Signal |
| Immediate Resistance 1 | 0.00001388 | Bollinger EMA cluster cap |
| Resistance 2 | 0.00001466 | Key rejection zone |
| Support 1 | 0.00001295 | Trendline and Fib 0.236 support |
| Support 2 | 0.00001185–0.00001220 | Horizontal support zone |
| RSI (30-min) | 54.82 | Neutral to weak bullish |
| MACD (30-min) | Weak crossover | Momentum fading |
| Bollinger Bands (4H) | Contracting | Low volatility buildup |
| Stoch RSI (30-min) | Oversold | Awaiting bullish crossover |
| Trend Bias | Neutral-Bullish | Above key supports |
Disclaimer: The information presented in this article is for informational and educational purposes only. The article does not constitute financial advice or advice of any kind. Coin Edition is not responsible for any losses incurred as a result of the utilization of content, products, or services mentioned. Readers are advised to exercise caution before taking any action related to the company.