

- TIA/USDT tests $2.60 support; analysts see $6.69 potential by mid-2025 if the breakout holds above $3.50.
- Fibonacci levels and trendline breaks suggest bullish momentum; $2.546 remains pivotal for a sustained rally.
- Analysts predict multi-leg gains to $6.69, citing higher lows and structural support; $3.50 breakout confirmation is key.
TIA/USDT has entered a critical range near the $2.60 mark after reclaiming a major descending trendline. Analysts are now watching for a bullish continuation toward the $6.69 region by mid-2025, pending confirmation of support retention.
Fibonacci Levels and Breakout Retests Signal TIA’s Potential Upside to $6.69 by 2025
A structural shift has emerged in TIA’s daily chart, with analysts highlighting Fibonacci levels, breakout retests, and support zone compression as signs of building bullish pressure . Price is consolidating near a multi-tested support level, aligning with key retracement indicators and a series of higher lows. If current levels hold, projections show potential upside to $6.69 by July 2025.
 Source: Post on X
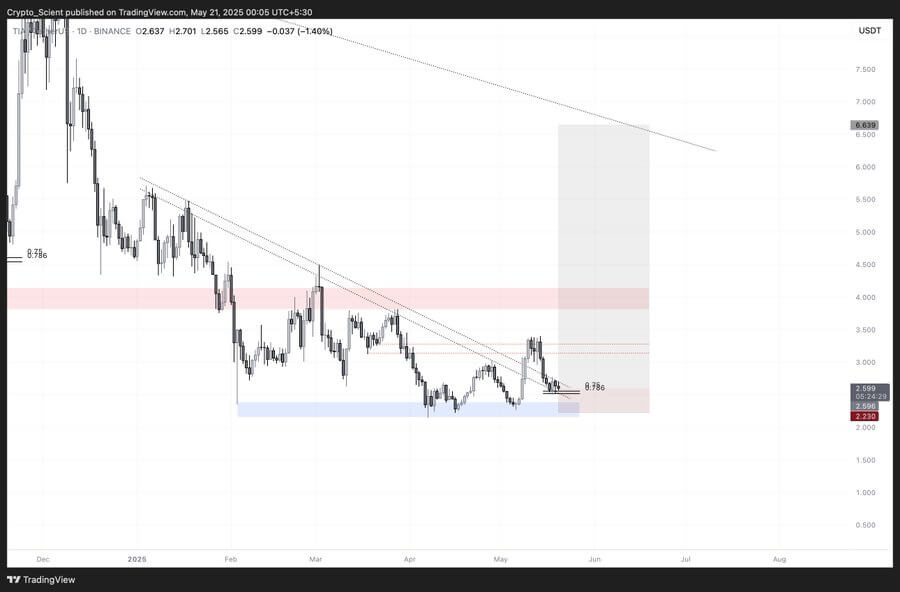
As we can see from the post above, one bullish analyst, Scient, has identified a key technical setup in TIA’s recent chart behavior. The analyst points to a clean break above the daily descending trendline, followed by a precise retest at the 0.786 Fibonacci level around $2.599. This retracement zone is known for signaling deeper corrections and often serves as a launch point for reversals.
The long position is based on a textbook breakout-retest formation, with additional entries planned between the current level and $2.50. A stop-loss is placed just below the most recent higher low to protect against a breakdown. The price target of $6.693 aligns with a projected grey resistance box, which connects with previous trendline resistance stretching from earlier highs.
The current market compression between $2.230 and $2.599 mirrors past accumulation structures that preceded significant rallies. While the immediate trend remains cautious, the formation of higher lows and structural retest indicates a transition from bearish control to potential bullish momentum.
Maven Targets Multi-Leg Rally If $3.50 Breaks
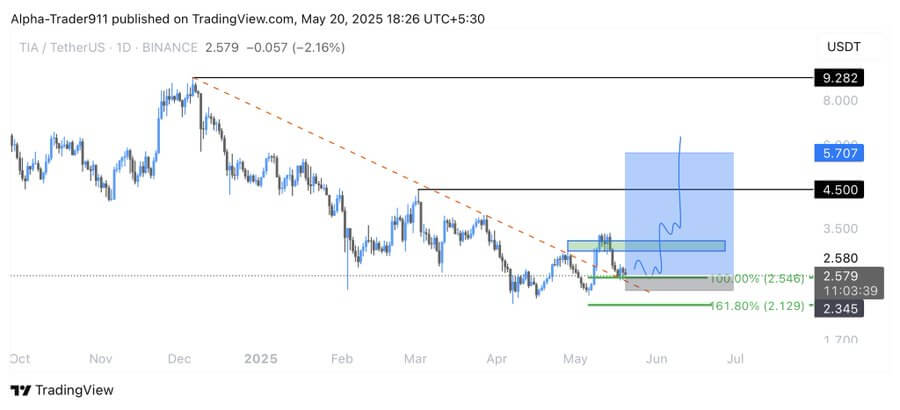
According to another analyst, Maven, TIA is showing signs of a bullish cycle in development, supported by multiple Fibonacci retracement levels and trendline breaks. He marks the 100% Fibonacci level at $2.546 as a pivotal structure, noting that price has tested and respected this zone multiple times since March. A visual path on his chart projects a potential continuation from current levels to $3.20, then toward $4.50 and $5.707.
 Source: Post on X
The $3.500 mark is identified as the primary resistance to break before any upward trend can fully develop. The recent bounce from a support range between $2.546 and $2.345 demonstrates strong demand, especially given its overlap with historical price clusters and previous swing lows. A broader outlook includes a potential return to the December high of $9.282 if momentum builds beyond $5.70.
The ongoing formation is compared with previous wave structures seen in TIA’s price chart, suggesting that the current pattern could be the early stage of a broader trend reversal. While momentum indicators remain limited, the sequence of higher lows and the recent trendline breach create a bullish base structure with cyclical potential.
Price Path Hinges on $3.50 Breakout
The bullish projections from both analysts hinge on TIA breaking through the $3.500 resistance level, which has capped previous rallies. If this zone is cleared with volume confirmation, a multi-leg rally toward $6.693 by July 2025 becomes increasingly likely. Conversely, failure to hold above $2.546 could signal a return to bearish conditions.
Overall, the technical landscape reflects a bullish-to-neutral bias, with structural signals aligning for a potential reversal. Traders are watching for a confirmed breakout and sustained closes above key resistance to validate the next upward leg . While upside potential is evident, short-term volatility and resistance zones warrant cautious optimism.