

Date: Wed, May 21, 2025 | 07:38 AM GMT
The cryptocurrency market has mounted a solid comeback in recent weeks, with Ethereum (ETH) continuing to lead the charge. ETH has surged more than 56% in the past month and is now trading near $2,550 — a level not seen since late February. This bullish momentum is uplifting sentiment across altcoins , including Artificial Superintelligence Alliance (FET).
FET has posted monthly gains of over 30%, and now a potential emerging technical structure could be the key to decoding its next move.
 Source: Coinmarketcap
Elliott Wave Impulse Pattern Signals More Upside
On the daily chart, FET appears to be forming a classic 5-wave Elliott Impulse pattern — a bullish technical setup that typically signals the continuation of a strong uptrend. So far, this structure has lifted FET by around 42% from its initial breakout point in April.
Wave 3 peaked at approximately $0.91, where the token faced some selling pressure and corrected back to $0.70. This move carved out Wave 4, a healthy 23% pullback that helped reset indicators and cool off short-term overbought conditions. Interestingly, this retracement held firmly above the 100-day moving average — currently acting as a strong support near $0.70 — and the price has already started to bounce from this level.
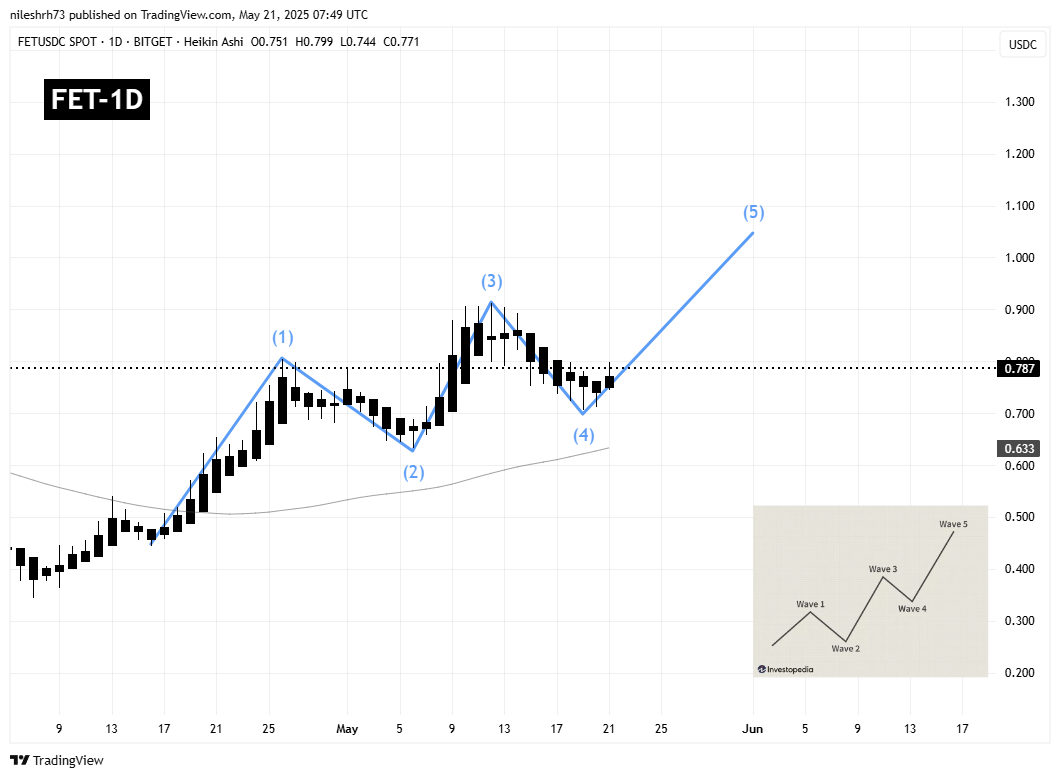 FET Daily Chart/Coinsprobe (Source: Tradingview)
FET is now trading around $0.78, hinting at the early stages of Wave 5 — the final leg in the Elliott pattern, which often delivers a powerful rally before a larger consolidation phase begins.
If the current structure continues to unfold according to plan, Wave 5 could push FET toward $1.04 — roughly a 50% gain from where the token currently stands. This target coincides with the 1.27 Fibonacci extension level from the Wave 2 to Wave 4 move, which often acts as a magnet in strong bullish trends.
Market structure aside, FET holding above the $0.70 region is crucial. This area is now a key support, and any sustained breakdown below it could invalidate the bullish setup. Should that happen, the next significant level to watch would be the 50-day moving average near $0.63.
What’s Next for FET?
FET appears to be at a critical moment. The current chart pattern suggests that the token could be entering Wave 5 — the final push of a bullish Elliott Wave cycle — with a possible target at $1.04 if momentum continues.
Disclaimer: This article is for informational purposes only and not financial advice. Always conduct your own research before investing in cryptocurrencies.

