SOL Price Alert: Key Breakout Incoming

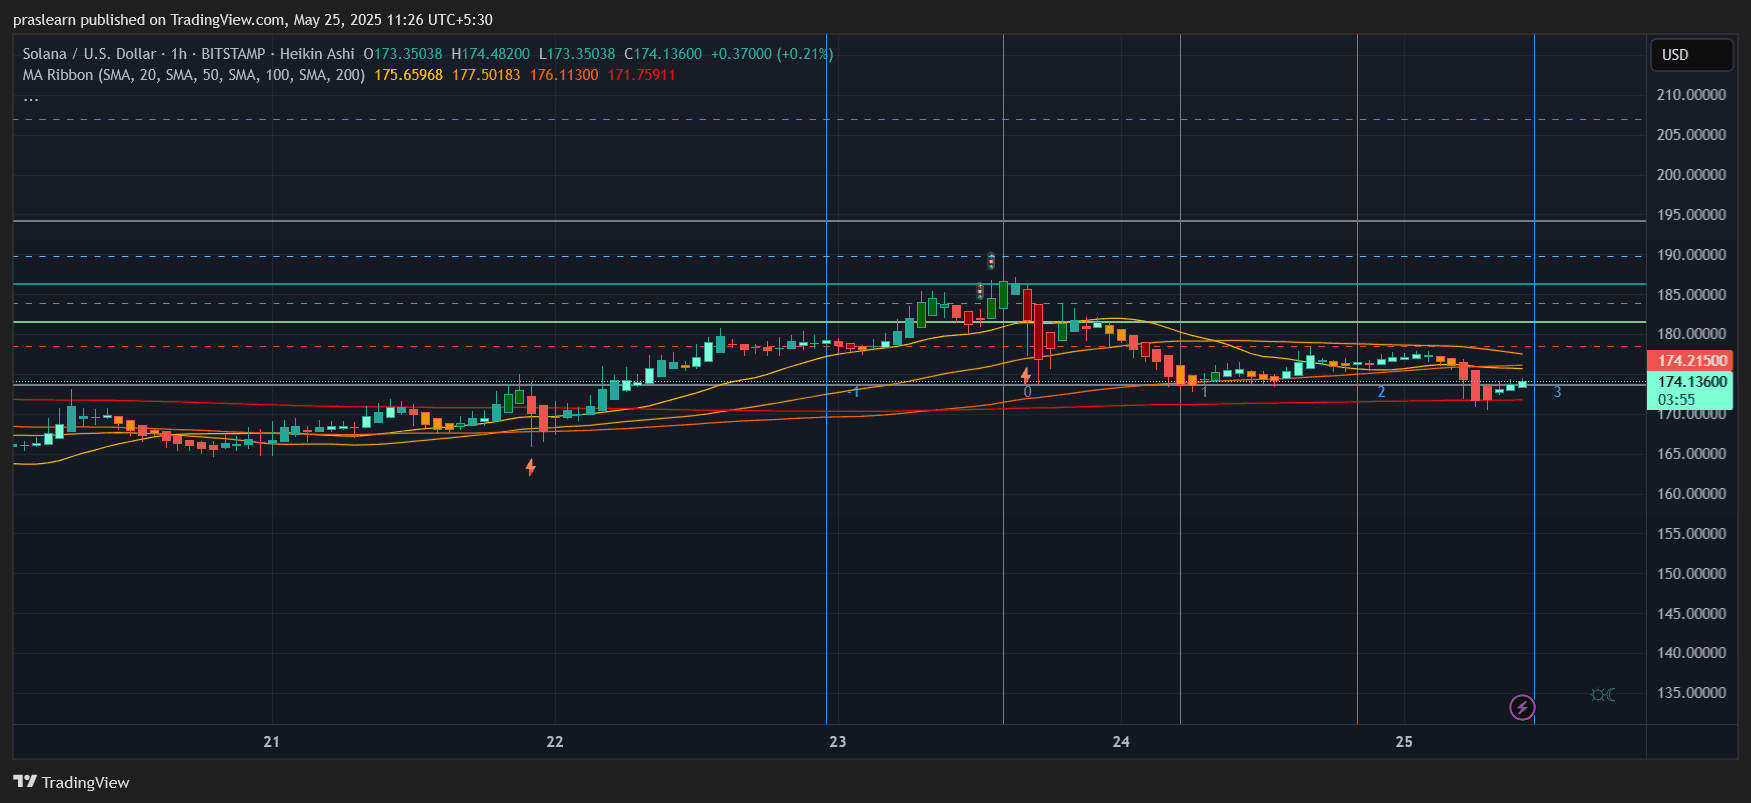
Solana price is currently trading around $174 , hovering slightly below its short-term resistance. The hourly chart shows that SOL recently dipped below its 50 and 100-period moving averages but is now attempting a recovery from the $171 zone, a crucial support area reinforced by the 200 SMA on the hourly timeframe.
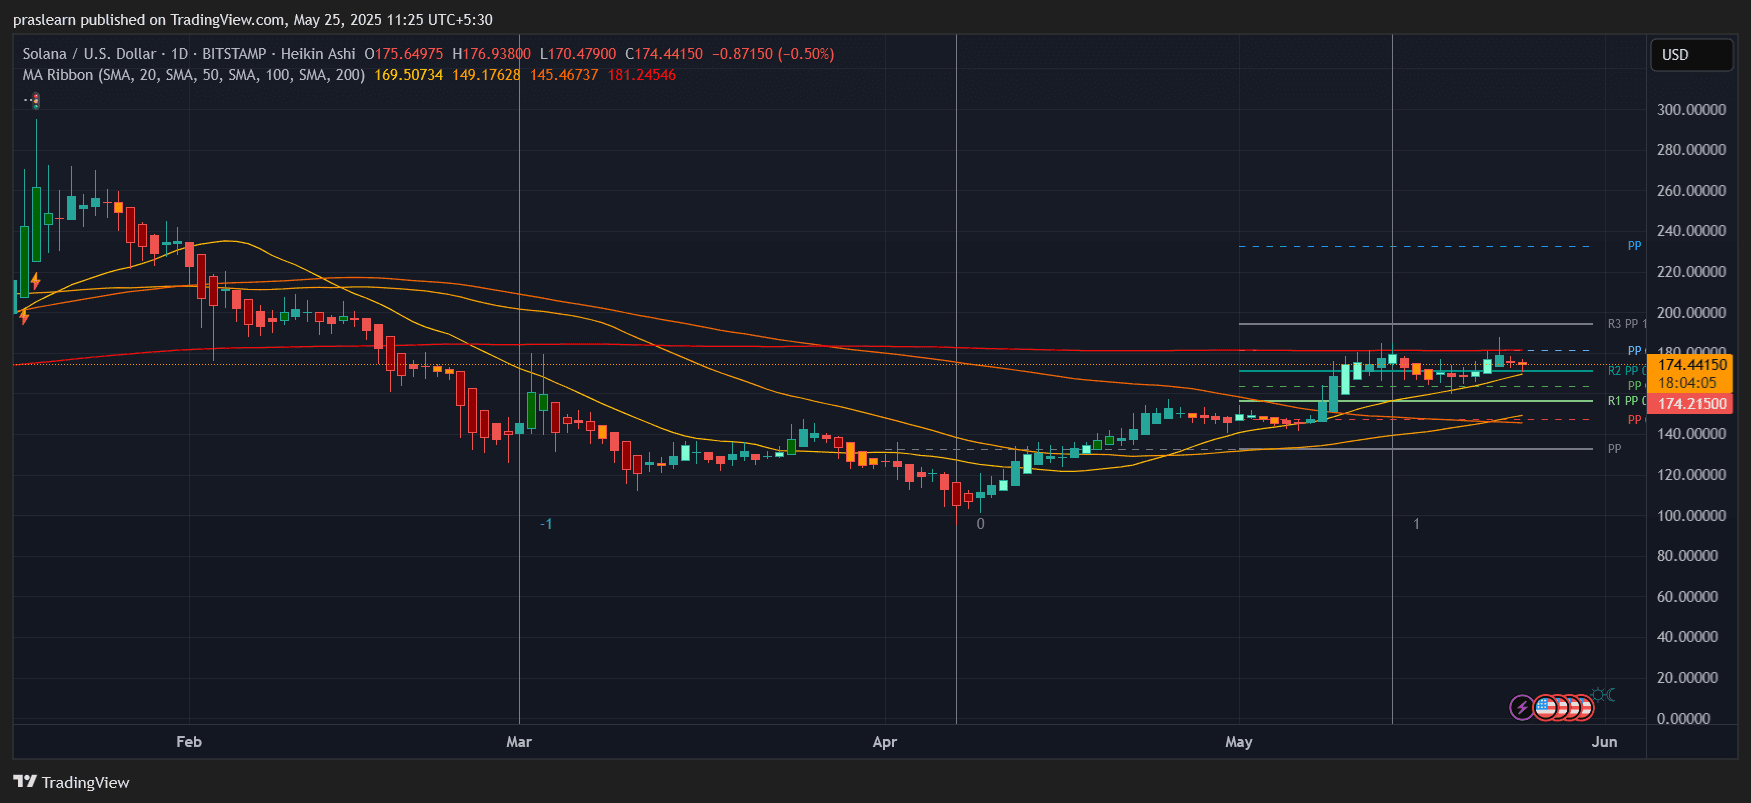
The daily chart reflects broader strength. After a prolonged downtrend earlier this year, Solana price has reclaimed major moving averages and is now consolidating just below the key psychological resistance level at $180, suggesting a brewing breakout.
Solana Price Prediction: Is SOL Price Building Strength for a Bigger Move?
 SOL/USD Daily Chart- TradingView
On the daily chart, SOL price has successfully broken above the 50-day SMA ($149) and 100-day SMA ($145), and is now confronting the 200-day SMA at $181. This long-term resistance level is critical — a confirmed breakout above this could fuel a sharp rally.
This setup resembles a classic bullish continuation after an accumulation phase between March and early May. The price has formed higher lows, and volume-supported green candles indicate smart money entering on dips.
Let’s validate the current momentum using simple calculations:
- From the local bottom at $118 (early April) to the recent high at $183, SOL gained around +55%.
- A Fibonacci extension (1.618 level) from this leg suggests a target of approximately $225, which matches the R3 pivot resistance visible on the chart.
If SOL price clears $181 (200-day SMA), it could quickly accelerate toward the $195-$200 zone, and then potentially $225 based on Fibonacci projections.
What Does the Hourly Chart Tell Us?
 SOL/USD 1 hr Chart- TradingView
The hourly chart indicates short-term caution. Solana price has been consolidating after a local high near $183, forming a mini head-and-shoulders pattern, followed by a dip below the 50 and 100 SMA lines, which now act as resistance.
But notably, the SOL price found support exactly at the 200 SMA (~$172) and is stabilizing with signs of a bounce. This level has held three times in the past 48 hours, forming a strong demand zone.
If buyers regain control and push above the $176-$178 band, SOL price could break back above intraday resistance, regaining bullish momentum. A move above $180 on hourly timeframe will confirm strength for a breakout attempt on the daily timeframe.
Solana Price Prediction: Will SOL Price Hit $200 Soon?
Technically, yes — if $181 is cleared with volume. Here’s the possible path:
- Break above $181 (200-day SMA and psychological barrier)
- Retest and hold above $180-$182 zone
- Rally toward $195, and if market-wide momentum supports, extend to $225 based on Fibonacci projection and previous pivot resistance
However, if $171 fails, Solana price may revisit $165 and potentially test $158, a previous accumulation zone.
Given the macro bullish structure and momentum in major altcoins, the odds currently favor a breakout.
Final Thoughts: Solana Price at a Crucial Decision Point
Solana price is approaching a pivotal moment . The daily chart structure is bullish, and historical patterns suggest a potential for another 20%-30% upside. However, short-term traders should watch the $171 support and $181 resistance levels closely.
If SOL price successfully flips $181 into support, we may soon witness the token charging toward $200 and beyond — and the next leg of the altcoin season may just be getting started.
Solana price is currently trading around $174 , hovering slightly below its short-term resistance. The hourly chart shows that SOL recently dipped below its 50 and 100-period moving averages but is now attempting a recovery from the $171 zone, a crucial support area reinforced by the 200 SMA on the hourly timeframe.
The daily chart reflects broader strength. After a prolonged downtrend earlier this year, Solana price has reclaimed major moving averages and is now consolidating just below the key psychological resistance level at $180, suggesting a brewing breakout.
Solana Price Prediction: Is SOL Price Building Strength for a Bigger Move?
SOL/USD Daily Chart- TradingView
On the daily chart, SOL price has successfully broken above the 50-day SMA ($149) and 100-day SMA ($145), and is now confronting the 200-day SMA at $181. This long-term resistance level is critical — a confirmed breakout above this could fuel a sharp rally.
This setup resembles a classic bullish continuation after an accumulation phase between March and early May. The price has formed higher lows, and volume-supported green candles indicate smart money entering on dips.
Let’s validate the current momentum using simple calculations:
- From the local bottom at $118 (early April) to the recent high at $183, SOL gained around +55%.
- A Fibonacci extension (1.618 level) from this leg suggests a target of approximately $225, which matches the R3 pivot resistance visible on the chart.
If SOL price clears $181 (200-day SMA), it could quickly accelerate toward the $195-$200 zone, and then potentially $225 based on Fibonacci projections.
What Does the Hourly Chart Tell Us?
SOL/USD 1 hr Chart- TradingView
The hourly chart indicates short-term caution. Solana price has been consolidating after a local high near $183, forming a mini head-and-shoulders pattern, followed by a dip below the 50 and 100 SMA lines, which now act as resistance.
But notably, the SOL price found support exactly at the 200 SMA (~$172) and is stabilizing with signs of a bounce. This level has held three times in the past 48 hours, forming a strong demand zone.
If buyers regain control and push above the $176-$178 band, SOL price could break back above intraday resistance, regaining bullish momentum. A move above $180 on hourly timeframe will confirm strength for a breakout attempt on the daily timeframe.
Solana Price Prediction: Will SOL Price Hit $200 Soon?
Technically, yes — if $181 is cleared with volume. Here’s the possible path:
- Break above $181 (200-day SMA and psychological barrier)
- Retest and hold above $180-$182 zone
- Rally toward $195, and if market-wide momentum supports, extend to $225 based on Fibonacci projection and previous pivot resistance
However, if $171 fails, Solana price may revisit $165 and potentially test $158, a previous accumulation zone.
Given the macro bullish structure and momentum in major altcoins, the odds currently favor a breakout.
Final Thoughts: Solana Price at a Crucial Decision Point
Solana price is approaching a pivotal moment . The daily chart structure is bullish, and historical patterns suggest a potential for another 20%-30% upside. However, short-term traders should watch the $171 support and $181 resistance levels closely.
If SOL price successfully flips $181 into support, we may soon witness the token charging toward $200 and beyond — and the next leg of the altcoin season may just be getting started.
Disclaimer: The content of this article solely reflects the author's opinion and does not represent the platform in any capacity. This article is not intended to serve as a reference for making investment decisions.
You may also like
Hong Kong Launches Project to Automate Management of Tokenized Funds

Sol Strategies rings the 'STKE' listing bell: Solana's Wall Street debut

The Death of Charlie Kirk: America Lost the "Young Salesman" of the Crypto World