

- Coinbase chart shows a reversal with strong volume that reached the highest point seen in the past year
- A Wyckoff spring pattern appears at $200 and COIN climbs past $260 with key resistance flipped to support
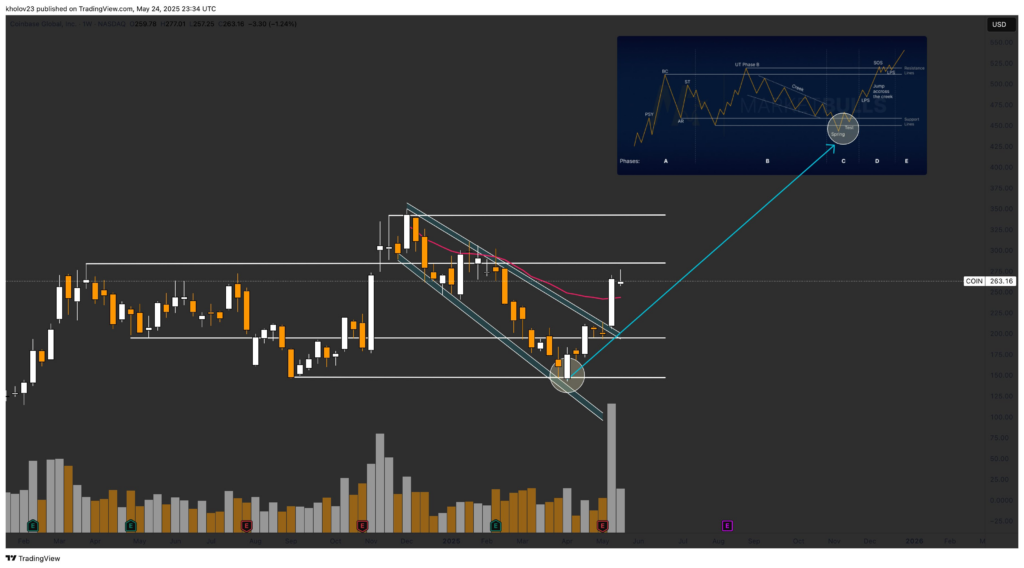
- Technical breakout from a 7-month falling wedge suggests a longer bullish trend may be taking shape soon
Coinbase Global Inc. (NASDAQ: COIN) may have exited a long-term downtrend as weekly price action shows a breakout from a falling channel. The weekly chart shows price surged above $260 after touching a low near $200, which formed a strong support zone . Price moved sharply higher on significant volume, breaking above both horizontal and diagonal resistance levels.
 Source: X
The downtrend began in late 2024, forming a clear falling wedge with lower highs and lower lows. This pattern ended in April 2025, followed by a strong bullish engulfing candle on high volume. A confluence of support levels marked the low, aligning with the lower boundary of the channel.
Volume increased sharply during the breakout week, suggesting strong buying interest at the $200–$210 range. The 50-day moving average was also breached, indicating a shift in momentum. Technical structure points toward a reversal rather than a short-term bounce.
Wyckoff Accumulation Phase C Suggests Markup Is Underway
The inset in the chart illustrates a Wyckoff accumulation schematic, with the price potentially entering Phase D of the structure. The highlighted circle on the main chart corresponds to the “Spring” or “Last Point of Support” (LPS) seen in Phase C of the Wyckoff model. This suggests the markdown may be complete.
According to Wyckoff theory, the Spring is the final shakeout before a new trend begins. The stock rebounded sharply after this shakeout, moving above the trading range established earlier. The move above previous resistance levels at $240 and $260 aligns with the start of a potential “Sign of Strength” (SOS) rally.
If the Wyckoff pattern plays out, the next targets are the resistance lines between $300 and $350. Volume confirmation and higher closes above these resistance levels would add credibility to this scenario. Historical behavior in similar setups shows sustained rallies once Phase D begins.
The schematic diagram provides a potential roadmap for future price action. A successful LPS followed by a markup often leads to new highs. Current price behavio r supports the idea that COIN may be transitioning into a longer-term bullish phase.
Volume Surge and Structural Shift Raise Key Question
The recent breakout and volume surge mark a clear change in structure. Weekly volume reached its highest level in over 12 months. Price closed above the 20-week moving average, further confirming trend reversal potential.
This breakout followed a period of price compression, often a precursor to strong directional moves. Previous resistance near $240 now acts as support. Buyers defended this level, indicating strong conviction. The technical shift poses one pivotal question: Is Coinbase entering a long-term bullish cycle driven by accumulation?
As the stock remains above key levels, traders and investors are watching for continuation patterns. If momentum holds, a retest of upper resistance zones is likely. The volume profile favors further upside if selling pressure remains limited. With structural breakout and Wyckoff signals aligning, the Coinbase chart offers a compelling case for a trend reversal in 2025.