

The Pi Network price today is trading at approximately $0.7766, showing minimal change from the previous session. The recent price action has entered a phase of tight compression, caught between converging trendlines and multiple short-term resistances. With volatility shrinking and volume declining, traders are closely watching for signs of breakout or breakdown ahead of May 27.
 Pi Network price analysis (Source: TradingView)
Despite a modest attempt to reclaim higher levels earlier this week, bulls have failed to generate meaningful follow-through. The broader structure on both the 4-hour and daily charts suggests indecision, with bears pressing down from the $0.79–$0.80 zone while bulls attempt to defend a fragile trendline from the May 15 low. Momentum signals now point to exhaustion, raising the question: why Pi Network price going down today, and will the consolidation hold or collapse?
What’s Happening With Pi Network’s Price?
 Pi Network price analysis (Source: TradingView)
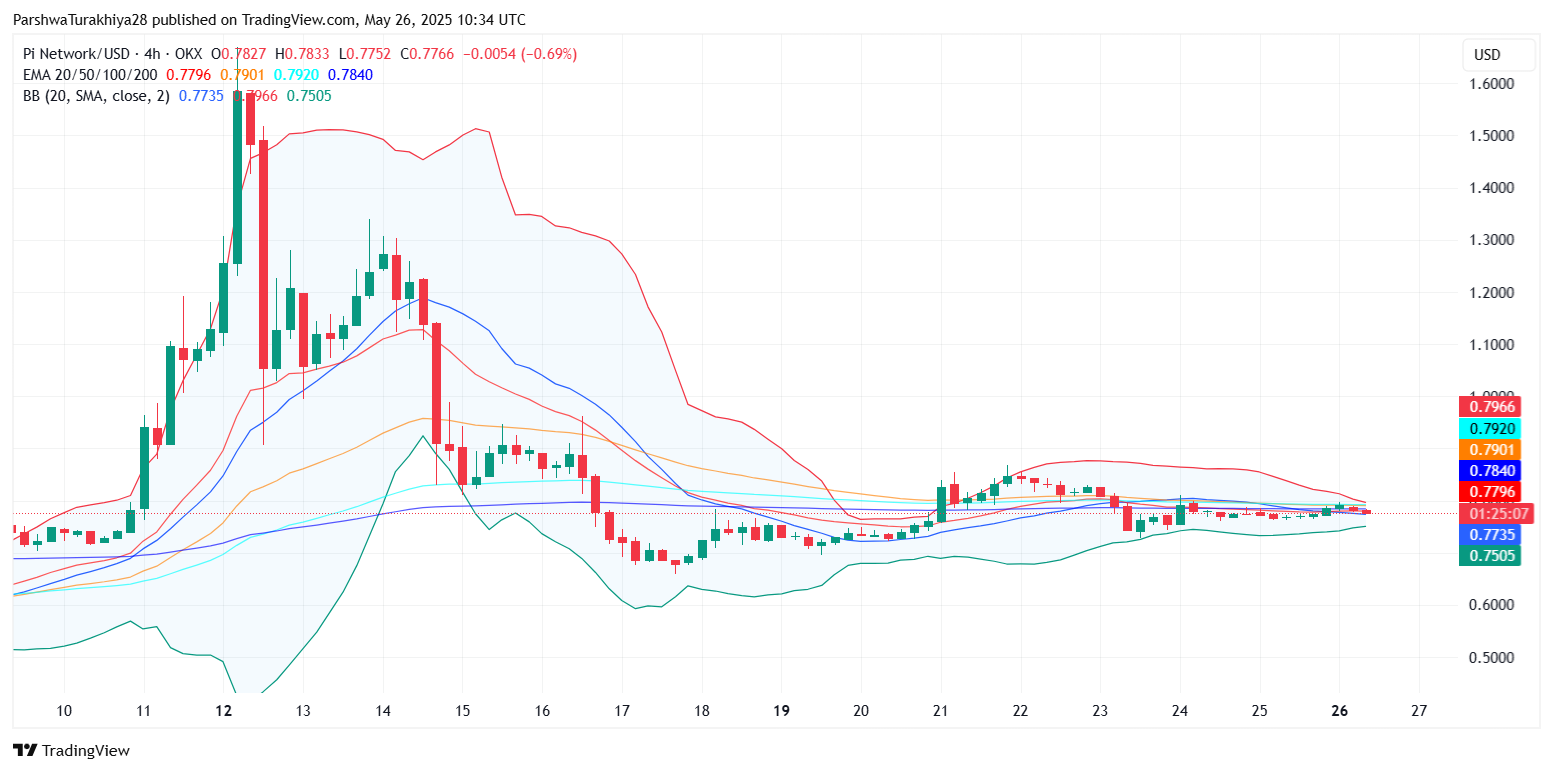
On the 4-hour chart, Pi Network price action has flattened between $0.774 and $0.783, with the Bollinger Bands narrowing significantly, indicating suppressed volatility. The 20, 50, 100, and 200 EMAs are all tightly clustered between $0.779 and $0.784, reflecting the indecisive sentiment. Price continues to hover near the midline of the Bollinger Bands, showing no clear directional bias.
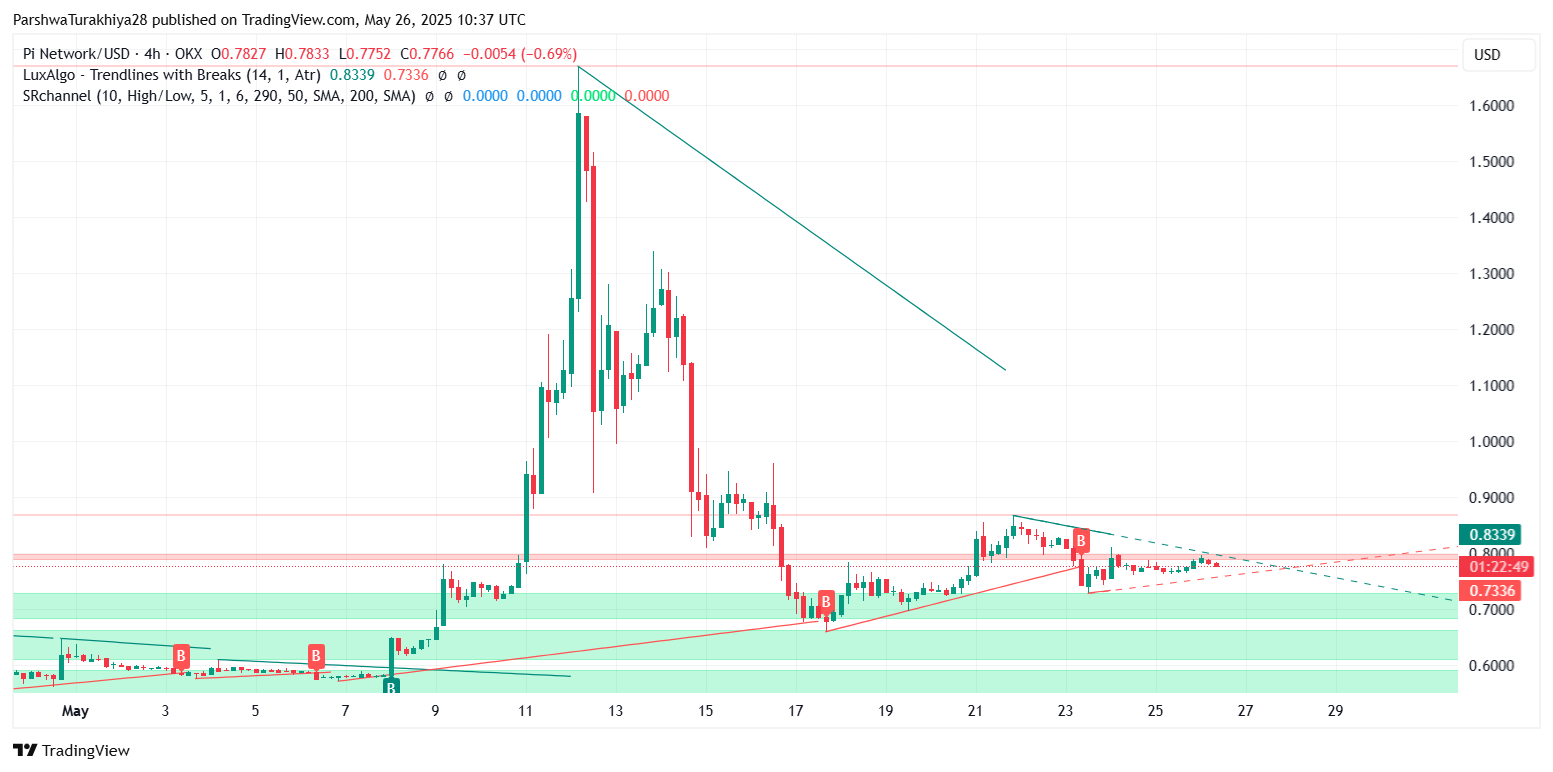
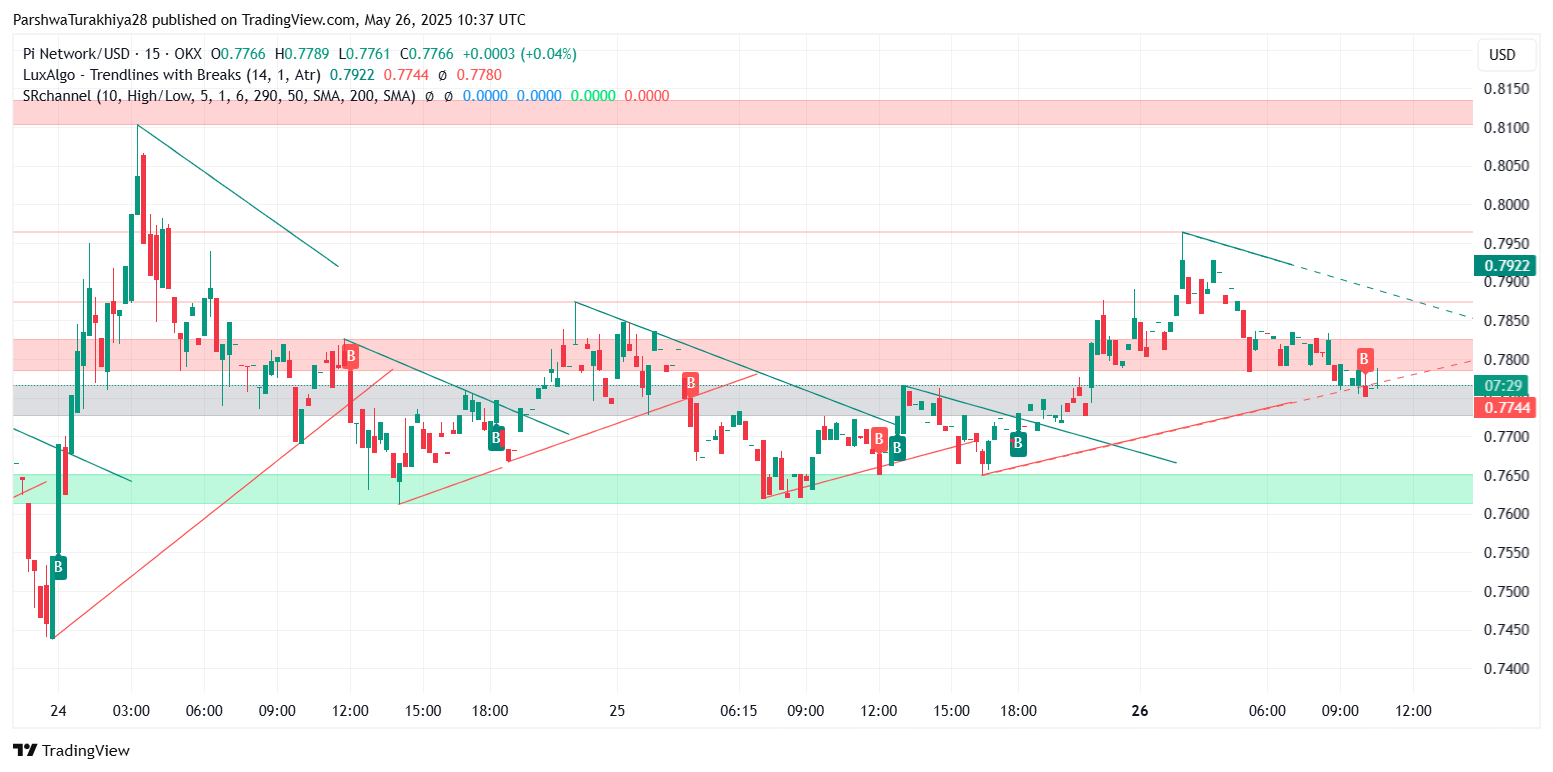
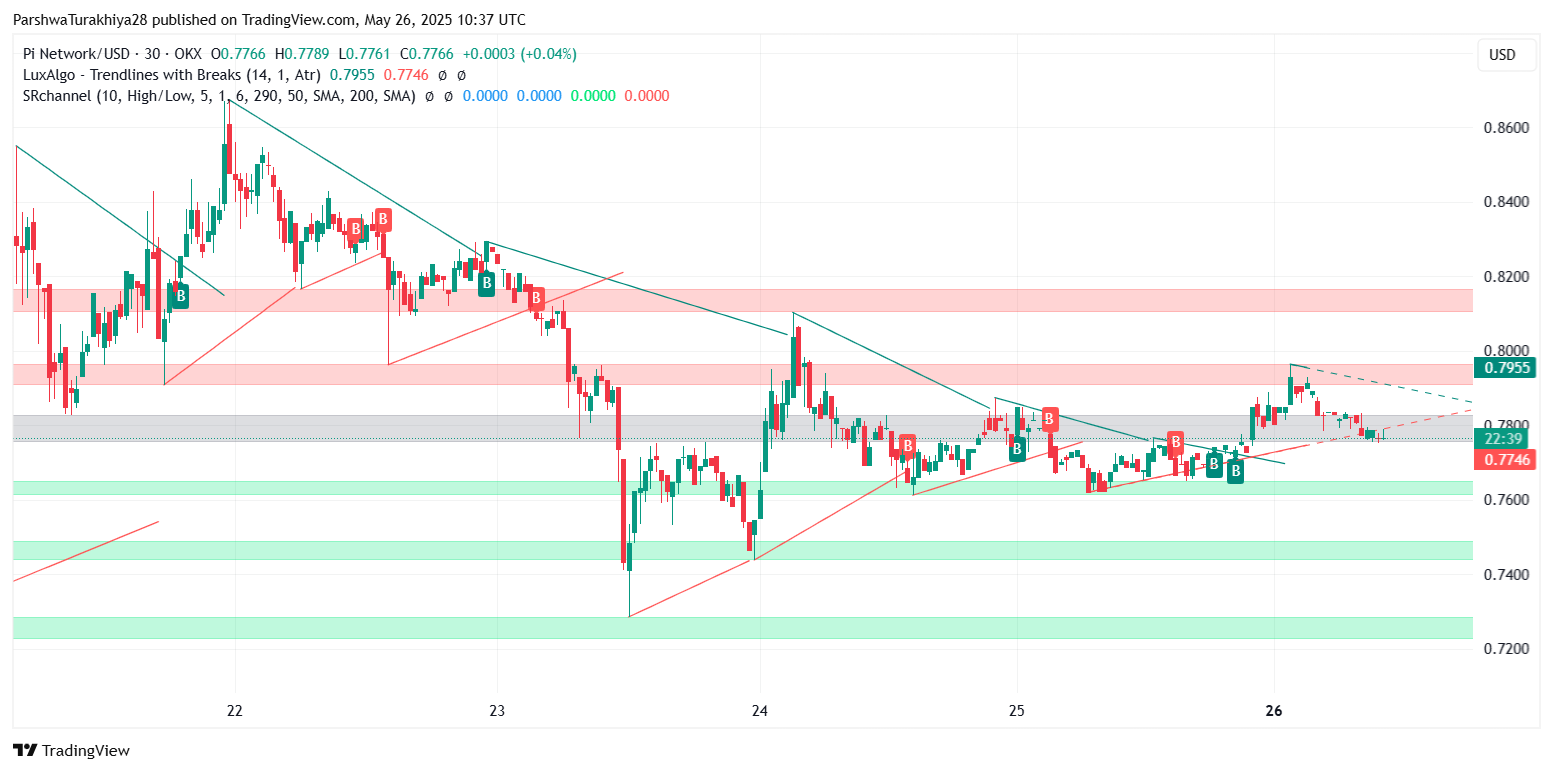
The broader trend, however, remains fragile. A descending wedge from the May 12 peak has yet to resolve with conviction. Price is still struggling to overcome the $0.7955 local resistance, with repeated rejections in that zone. Meanwhile, the lower support near $0.774 is weakening as buyers lose momentum.
 Pi Network price analysis (Source: TradingView)
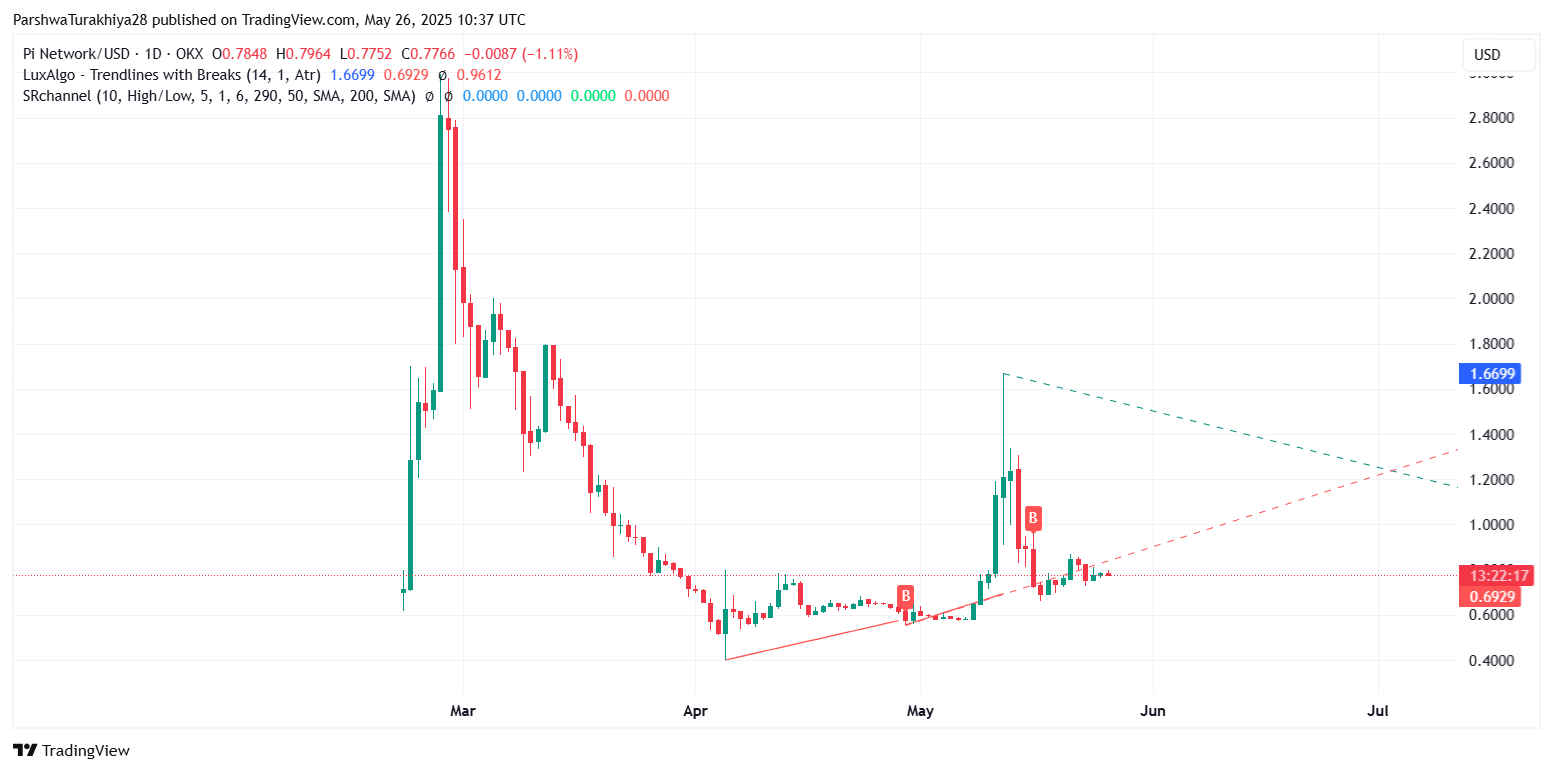
The daily structure further supports this uncertainty. Pi is trading just above the $0.7336 support trendline but has failed to confirm a breakout from the triangle pattern stretching from early May. A failure to hold above $0.774 could result in a move toward $0.733 and eventually the $0.70–$0.68 demand zone.
RSI, MACD, and Volatility Metrics Signal Bearish Tilt
 Pi Network price analysis (Source: TradingView)
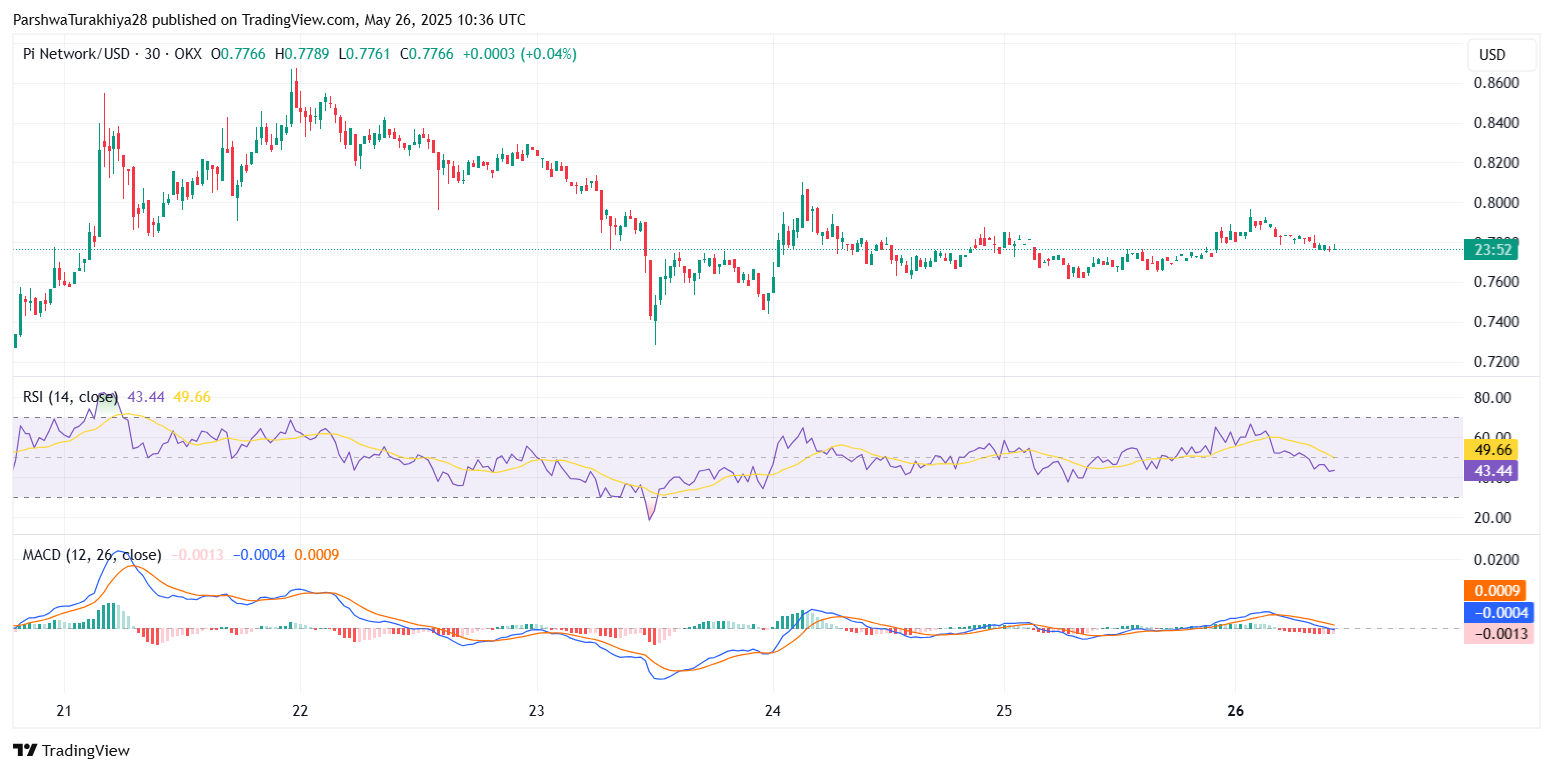
The 30-minute and 4-hour RSI readings are below the neutral 50 mark, with the latest print at 43.44, reflecting fading bullish momentum. On the 4-hour MACD, the signal line has crossed below the MACD line with histogram bars printing in the red. This crossover confirms short-term weakness and suggests bears may continue to test the lower boundaries of the current consolidation range.
 Pi Network price analysis (Source: TradingView)
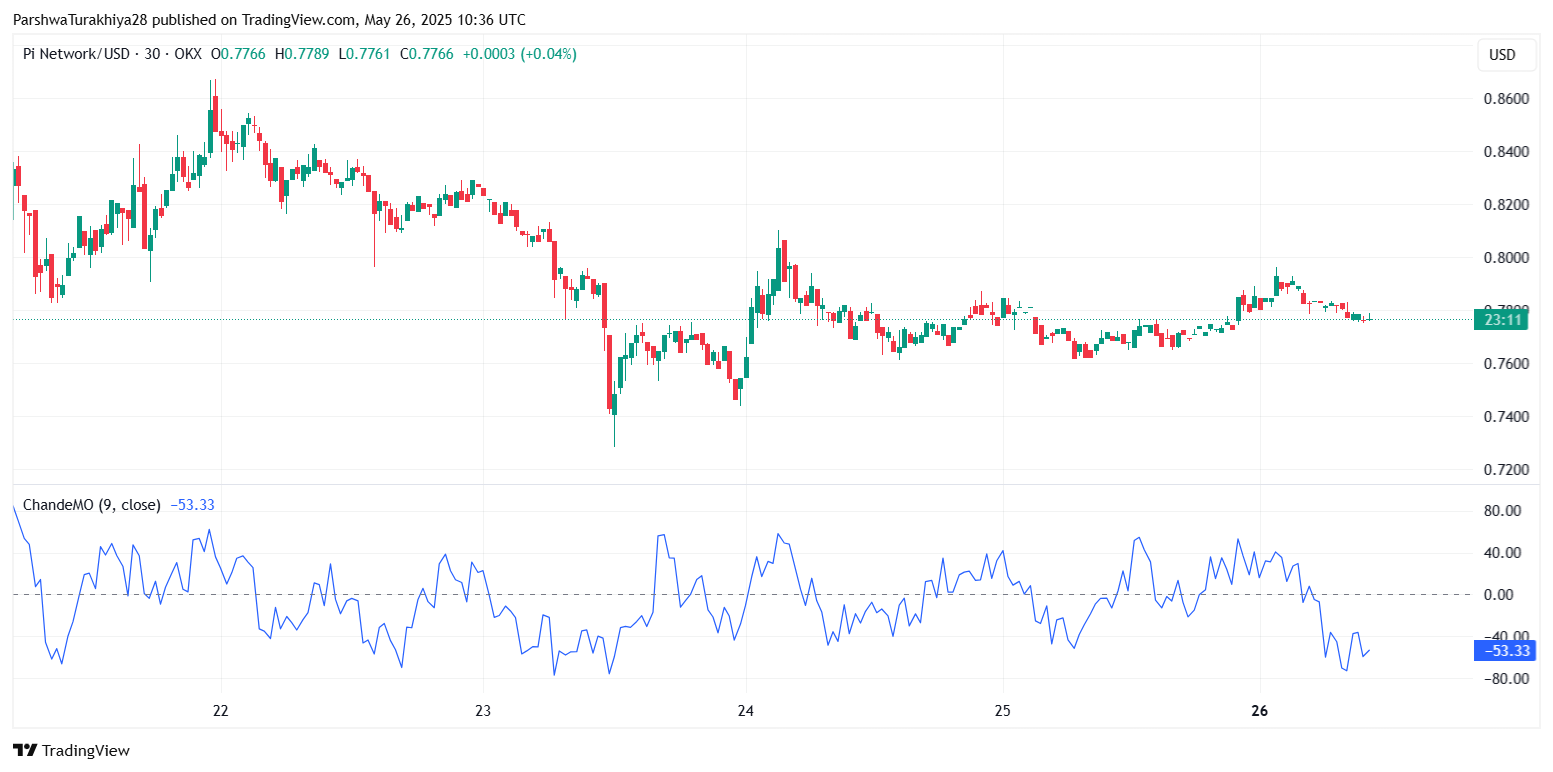
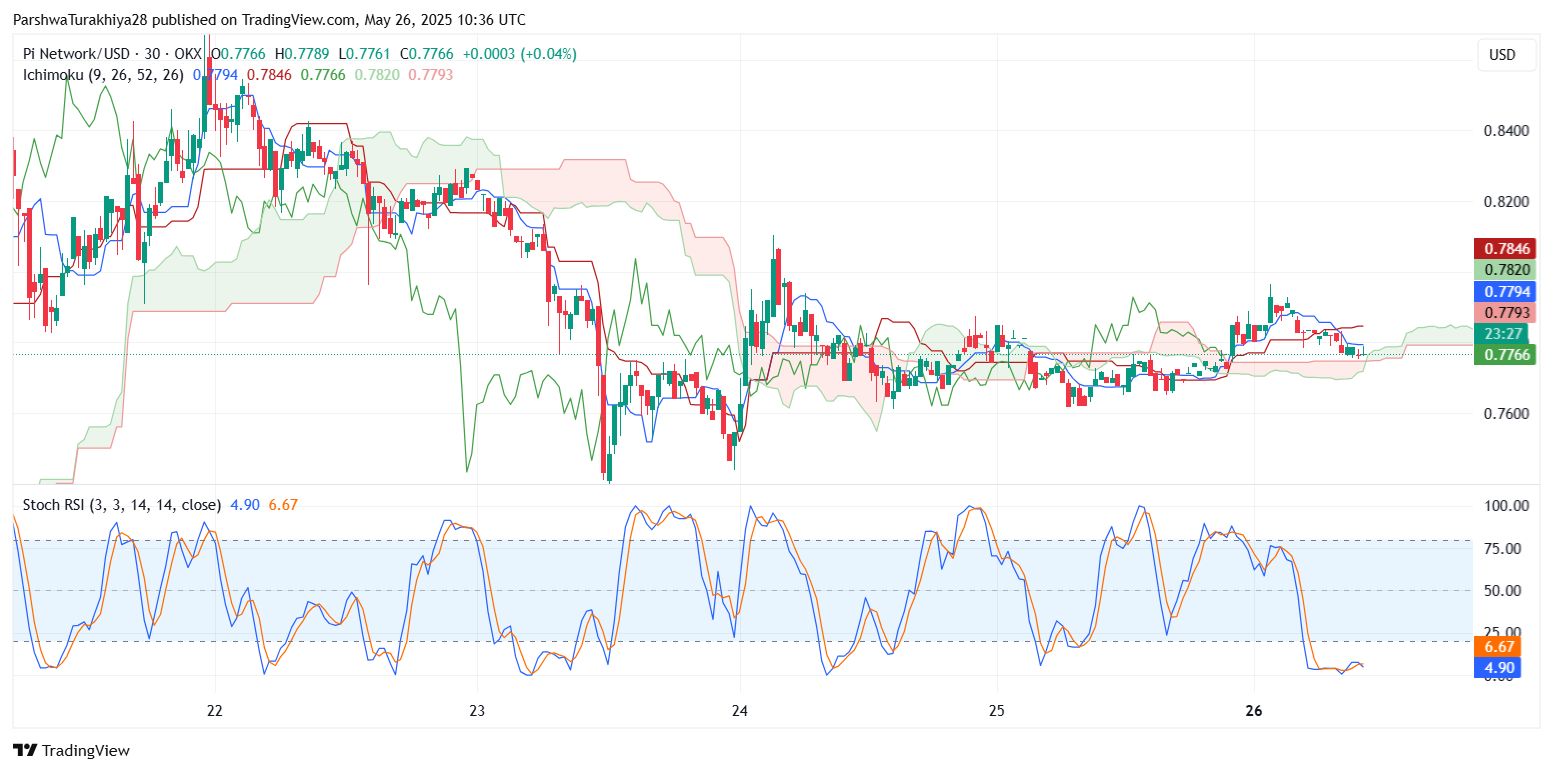
Pi Network price volatility has contracted notably. The Chande Momentum Oscillator is deep in negative territory at -53.33, reinforcing bearish underlying strength. Similarly, the Stochastic RSI on the 30-minute chart is hovering below 10, suggesting a potential reversal is overdue, though any bounce may be short-lived unless accompanied by strong volume.
 Pi Network price analysis (Source: TradingView)
The Ichimoku Cloud offers additional resistance confirmation. On the 30-minute timeframe, PI is stuck below the Kijun-sen and Tenkan-sen, both near $0.779–$0.782. The cloud is also relatively thin, indicating a lack of trend conviction. Unless PI decisively clears the $0.7846 upper cloud level, any upside will likely face headwinds.
Key Levels to Watch and Short-Term Outlook
 Pi Network price analysis (Source: TradingView)
The immediate resistance zone lies between $0.790 and $0.795, followed by a stronger cap near $0.8339. To regain bullish structure, PI must close above $0.80 on high volume, breaking the descending triangle that has kept price compressed for nearly a week.
On the downside, a breakdown below $0.774 exposes the $0.7505–$0.7336 demand zone. A failure to hold this area could result in a retest of $0.7000 and possibly $0.6820, where the 78.6% Fibonacci retracement lies.
Will Pi Network Break Down or Break Out?
 Pi Network price analysis (Source: TradingView)
The Pi Network price update suggests a cautious near-term outlook. With compression tightening and bearish momentum rising, downside risk is increasing unless bulls reclaim $0.784 convincingly. If price closes below $0.774, a test of lower Fibonacci supports becomes increasingly likely. On the other hand, reclaiming $0.80 could reinvigorate bullish sentiment and lead to a squeeze toward $0.833 or higher.
For now, traders should watch the $0.774 support and $0.795 resistance with laser focus. These zones will determine whether the next leg is a breakout or a breakdown.
| Indicator | Signal |
| RSI (30-min/4H) | Bearish (<50, declining) |
| MACD (4H) | Bearish crossover |
| Chande Momentum | Strong negative (-53.33) |
| Key Resistance | $0.784 – $0.795 |
| Key Support | $0.774 – $0.733 |
| Volatility Outlook | Shrinking, breakout incoming |
Disclaimer: The information presented in this article is for informational and educational purposes only. The article does not constitute financial advice or advice of any kind. Coin Edition is not responsible for any losses incurred as a result of the utilization of content, products, or services mentioned. Readers are advised to exercise caution before taking any action related to the company.