
QNT Trading Volume Jumps 500% After Quant Network’s Layer 2.5 Announcement

Quant (QNT) is gaining strength after announcing Overledger Fusion and Quant Flow, driving a sharp rally backed by bullish technical signals.
Quant (QNT) is gaining momentum after unveiling Overledger Fusion and Quant Flow, two major initiatives aimed at bridging institutional finance and DeFi. The announcements fueled a nearly 13% price surge, pushing technical indicators like RSI and Ichimoku Cloud into clearly bullish territory.
RSI spiked above 77, signaling strong buying pressure. With bullish EMA alignment and key resistance levels approaching, QNT now faces a crucial test to determine if the rally can extend or pause for a short-term correction.
Quant Unveils Overledger Fusion and Quant Flow to Bridge Institutions and DeFi
Quant (QNT) jumped nearly 13% after CEO Gilbert Verdian announced Overledger Fusion, a new Layer 2.5 network connecting institutions, enterprises, and DeFi ecosystems.
The network introduces a multi-ledger rollup system that enables seamless interoperability across public blockchains while addressing institutional concerns like compliance, privacy, and scalability.
Fusion, which will begin rolling out in June 2025, also includes a Trusted Node Program, which allows approved operators to stake QNT and earn rewards based on transaction priority.
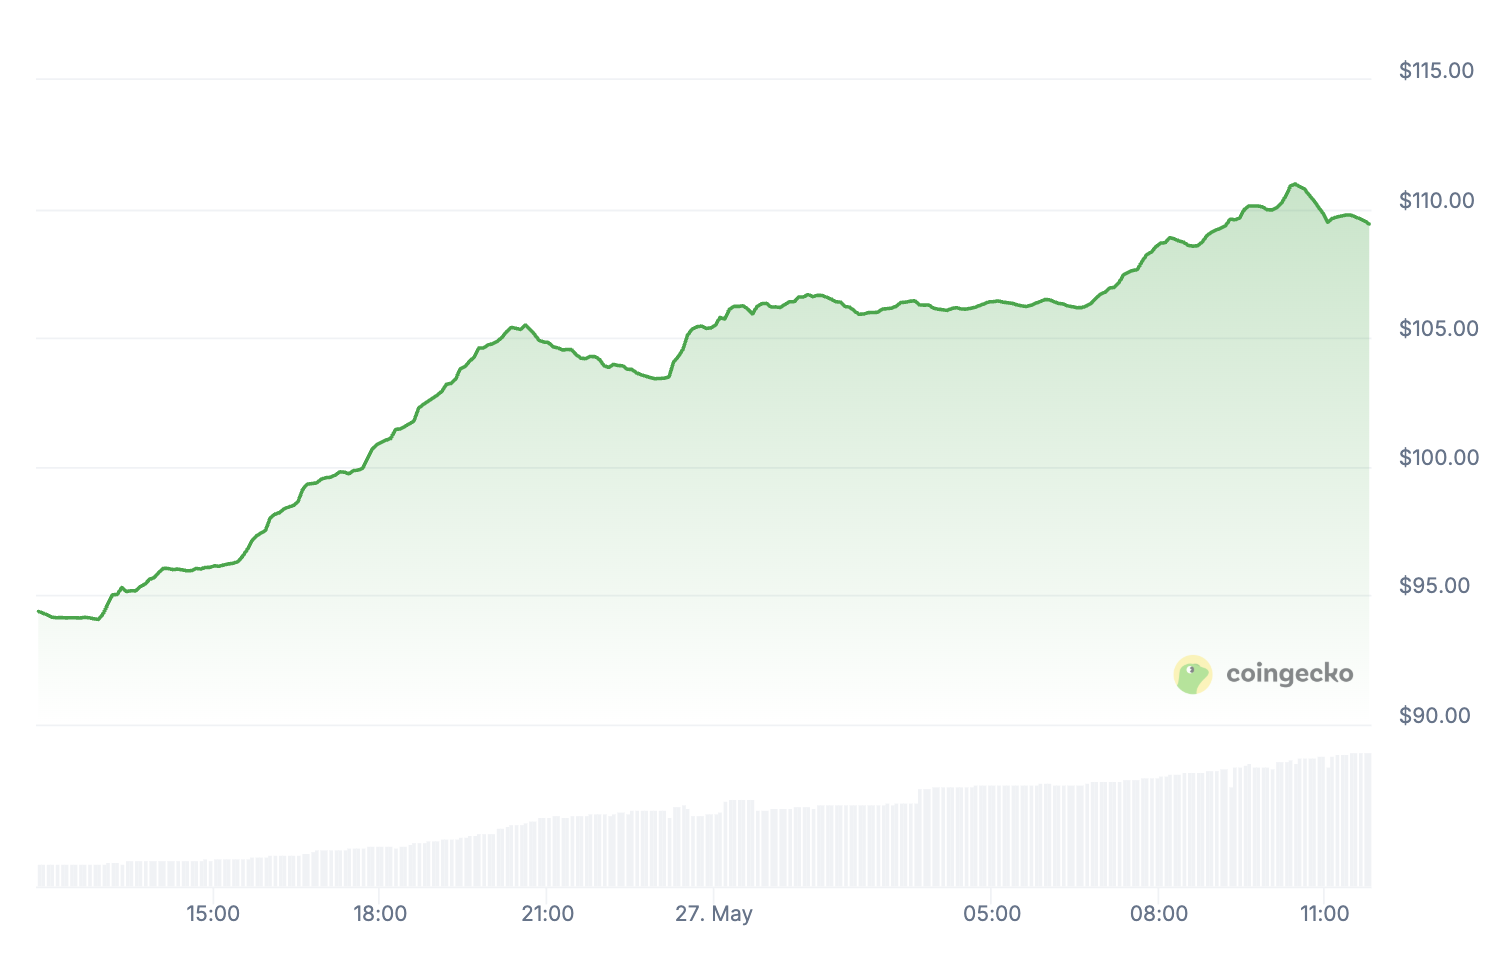 QNT Price in the last 24 hours. Source:
CoinGecko.
QNT Price in the last 24 hours. Source:
CoinGecko.
In parallel, Quant Network is expanding its Quant Flow platform, centered around its programmable payments language, PayScript®. Quant Flow automates complex financial operations, enabling rule-based payments, global transfers, and treasury workflows.
It supports both stablecoins and traditional currencies, offering speed, compliance, and flexibility for businesses of all sizes.
Overledger Fusion and Quant Flow represent a strategic push to make blockchain infrastructure practical for real-world institutional use.
QNT Shows Strong Momentum as RSI and Ichimoku Signals Align Bullish
QNT’s Relative Strength Index (RSI) spiked sharply to 77.78 following its recent price surge and currently holds at 73.66, up significantly from 48.40 just a day ago.
This rapid jump in momentum reflects strong buying pressure in response to the latest announcements from the Quant team.
The move places QNT well into overbought territory, signaling that bullish sentiment has accelerated quickly and may be approaching short-term exhaustion.
RSI is a momentum oscillator that measures the speed and magnitude of recent price changes. It ranges from 0 to 100. Typically, readings above 70 suggest an asset is overbought, while readings below 30 indicate it may be oversold.
 QNT RSI. Source:
TradingView.
QNT RSI. Source:
TradingView.
With QNT’s RSI now above 73, the token may be due for a cooldown or consolidation, especially if buyers start to take profits.
However, sustained overbought conditions can also occur during strong uptrends, so continued momentum isn’t off the table if bullish interest remains high.
The Ichimoku Cloud chart for QNT shows a clear bullish breakout, with the price strongly above the cloud and all key indicators aligned in favor of buyers.
The Tenkan-sen (blue line) has crossed above the Kijun-sen (red line), confirming short-term bullish momentum.
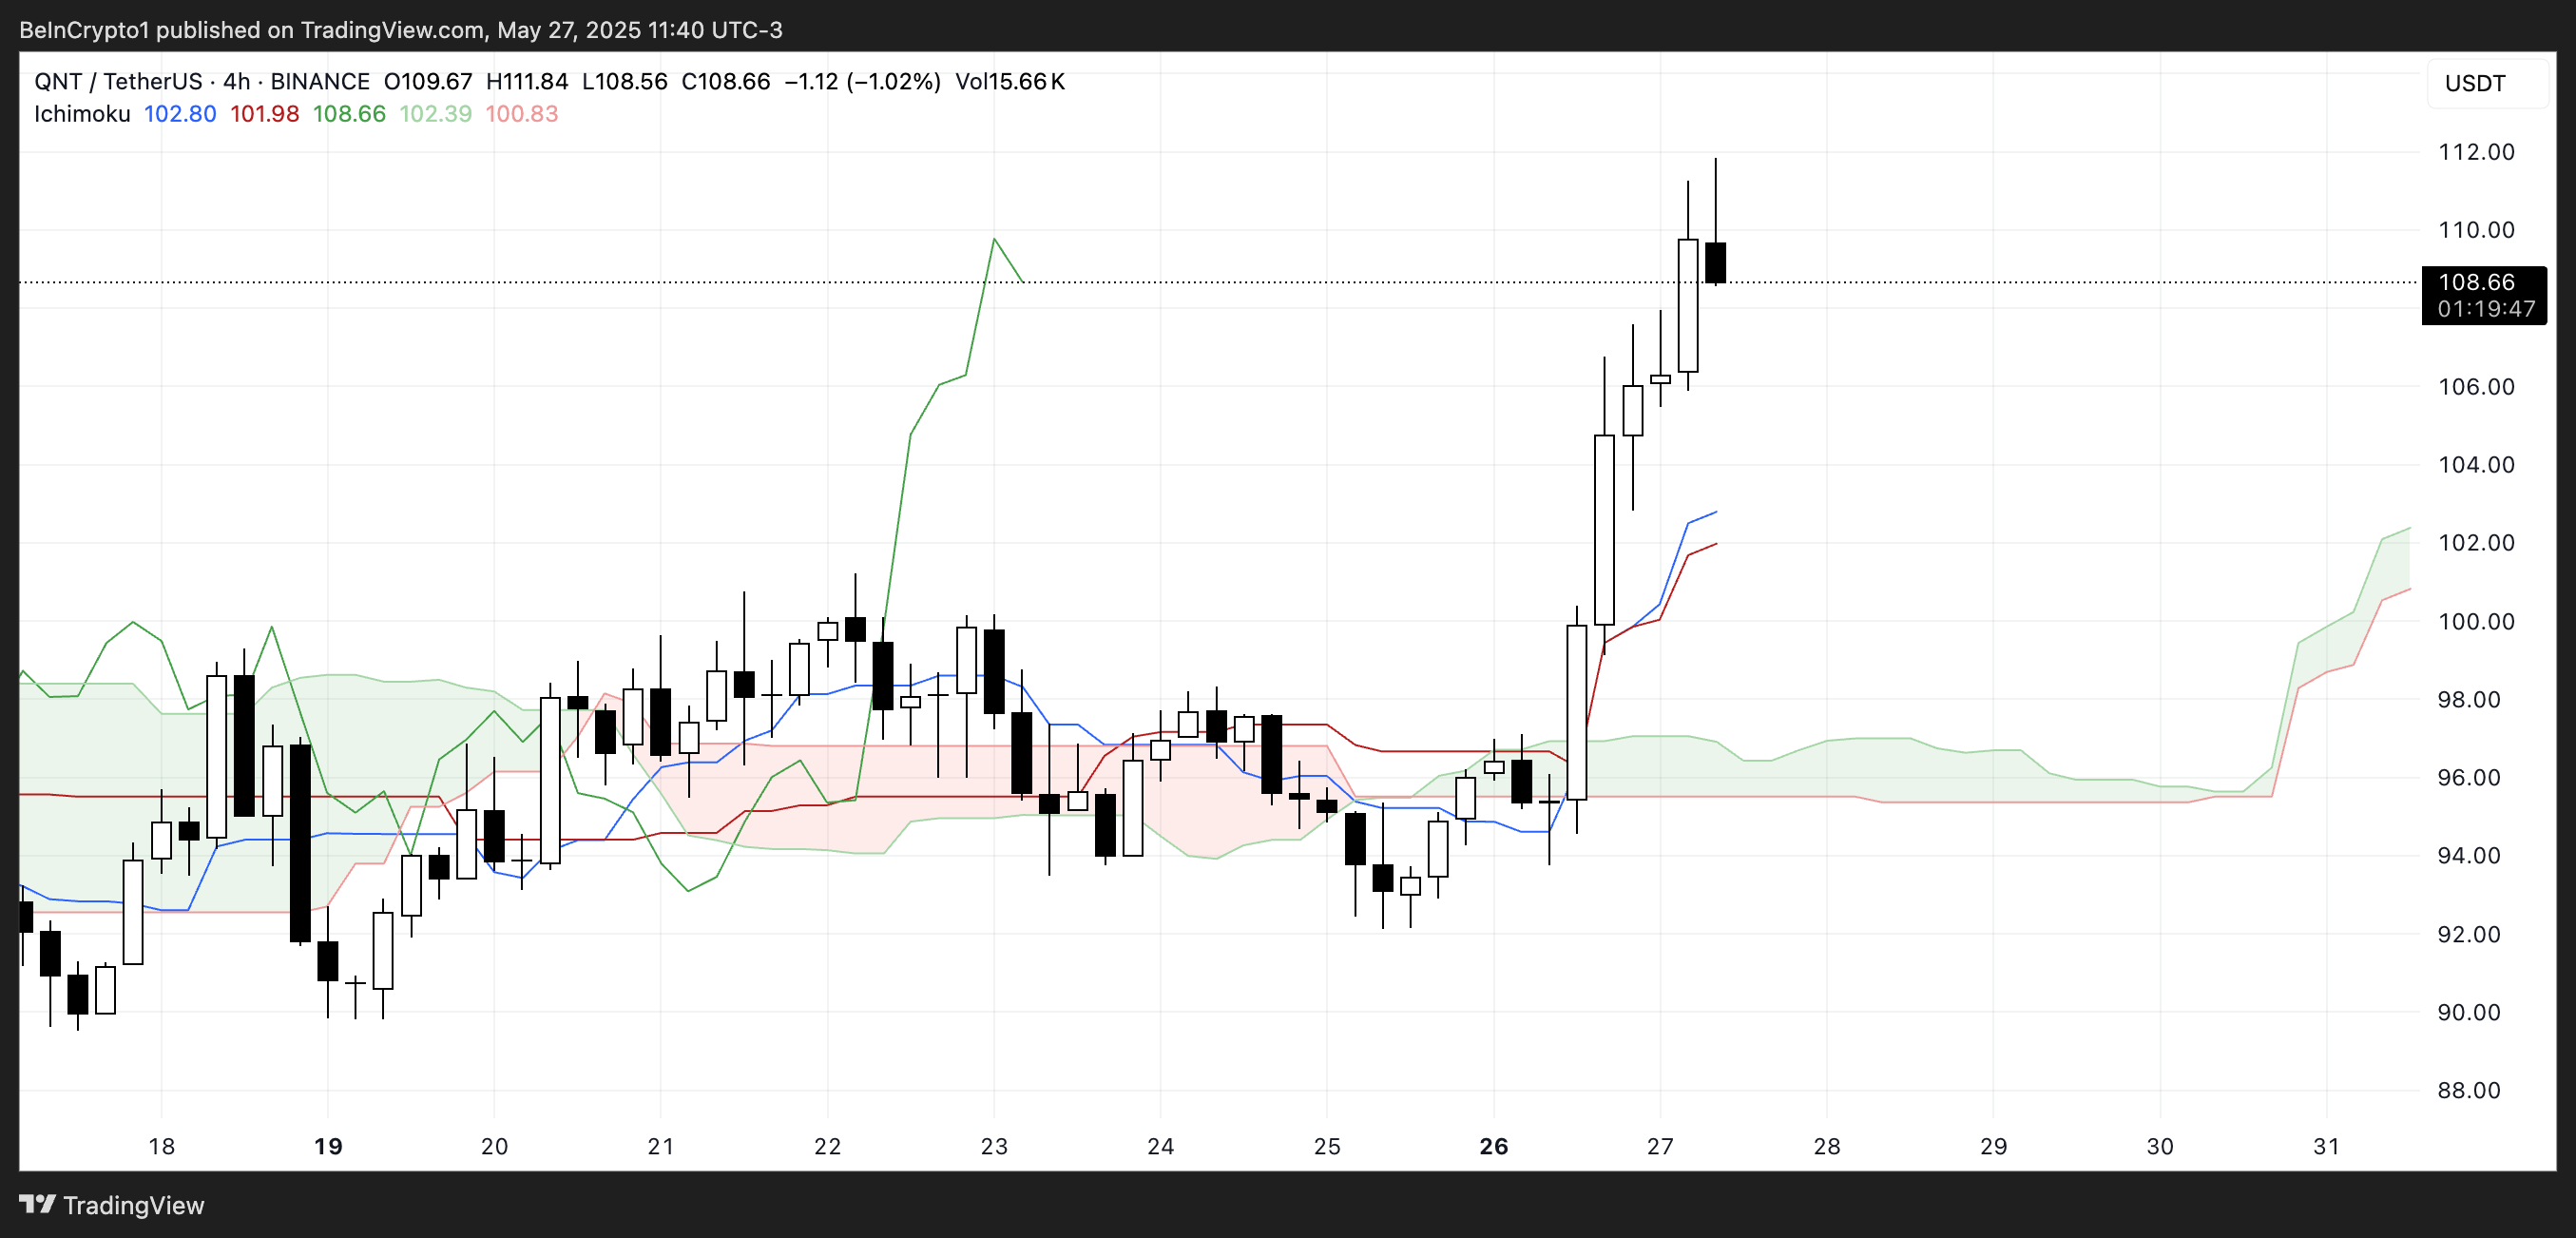 QNT Ichimoku Cloud. Source:
TradingView.
QNT Ichimoku Cloud. Source:
TradingView.
The cloud itself has turned green ahead, with the Senkou Span A (green boundary) positioned above Senkou Span B (red boundary), signaling potential continuation of the uptrend.
The price action has accelerated quickly, leaving the cloud far behind, indicating strong buyer conviction. With the Chikou Span (lagging line) well above past price action, momentum remains elevated.
However, the steep angle of the recent move may lead to short-term consolidation or profit-taking.
The overall structure points to bullish strength for now, but monitoring the Tenkan-sen for potential support will be key in the coming sessions.
QNT Eyes $115 as EMA Momentum Builds
Quant’s EMA lines are currently aligned in a bullish formation, supporting the strong upward momentum seen in recent sessions.
With prices climbing quickly, the next key resistance to watch is at $111.85. If bulls manage to break through this level, QNT could extend its rally and retest the $115 zone—a level not reached since January 21.
The upward trend remains intact as long as momentum holds and price stays above short-term moving averages.
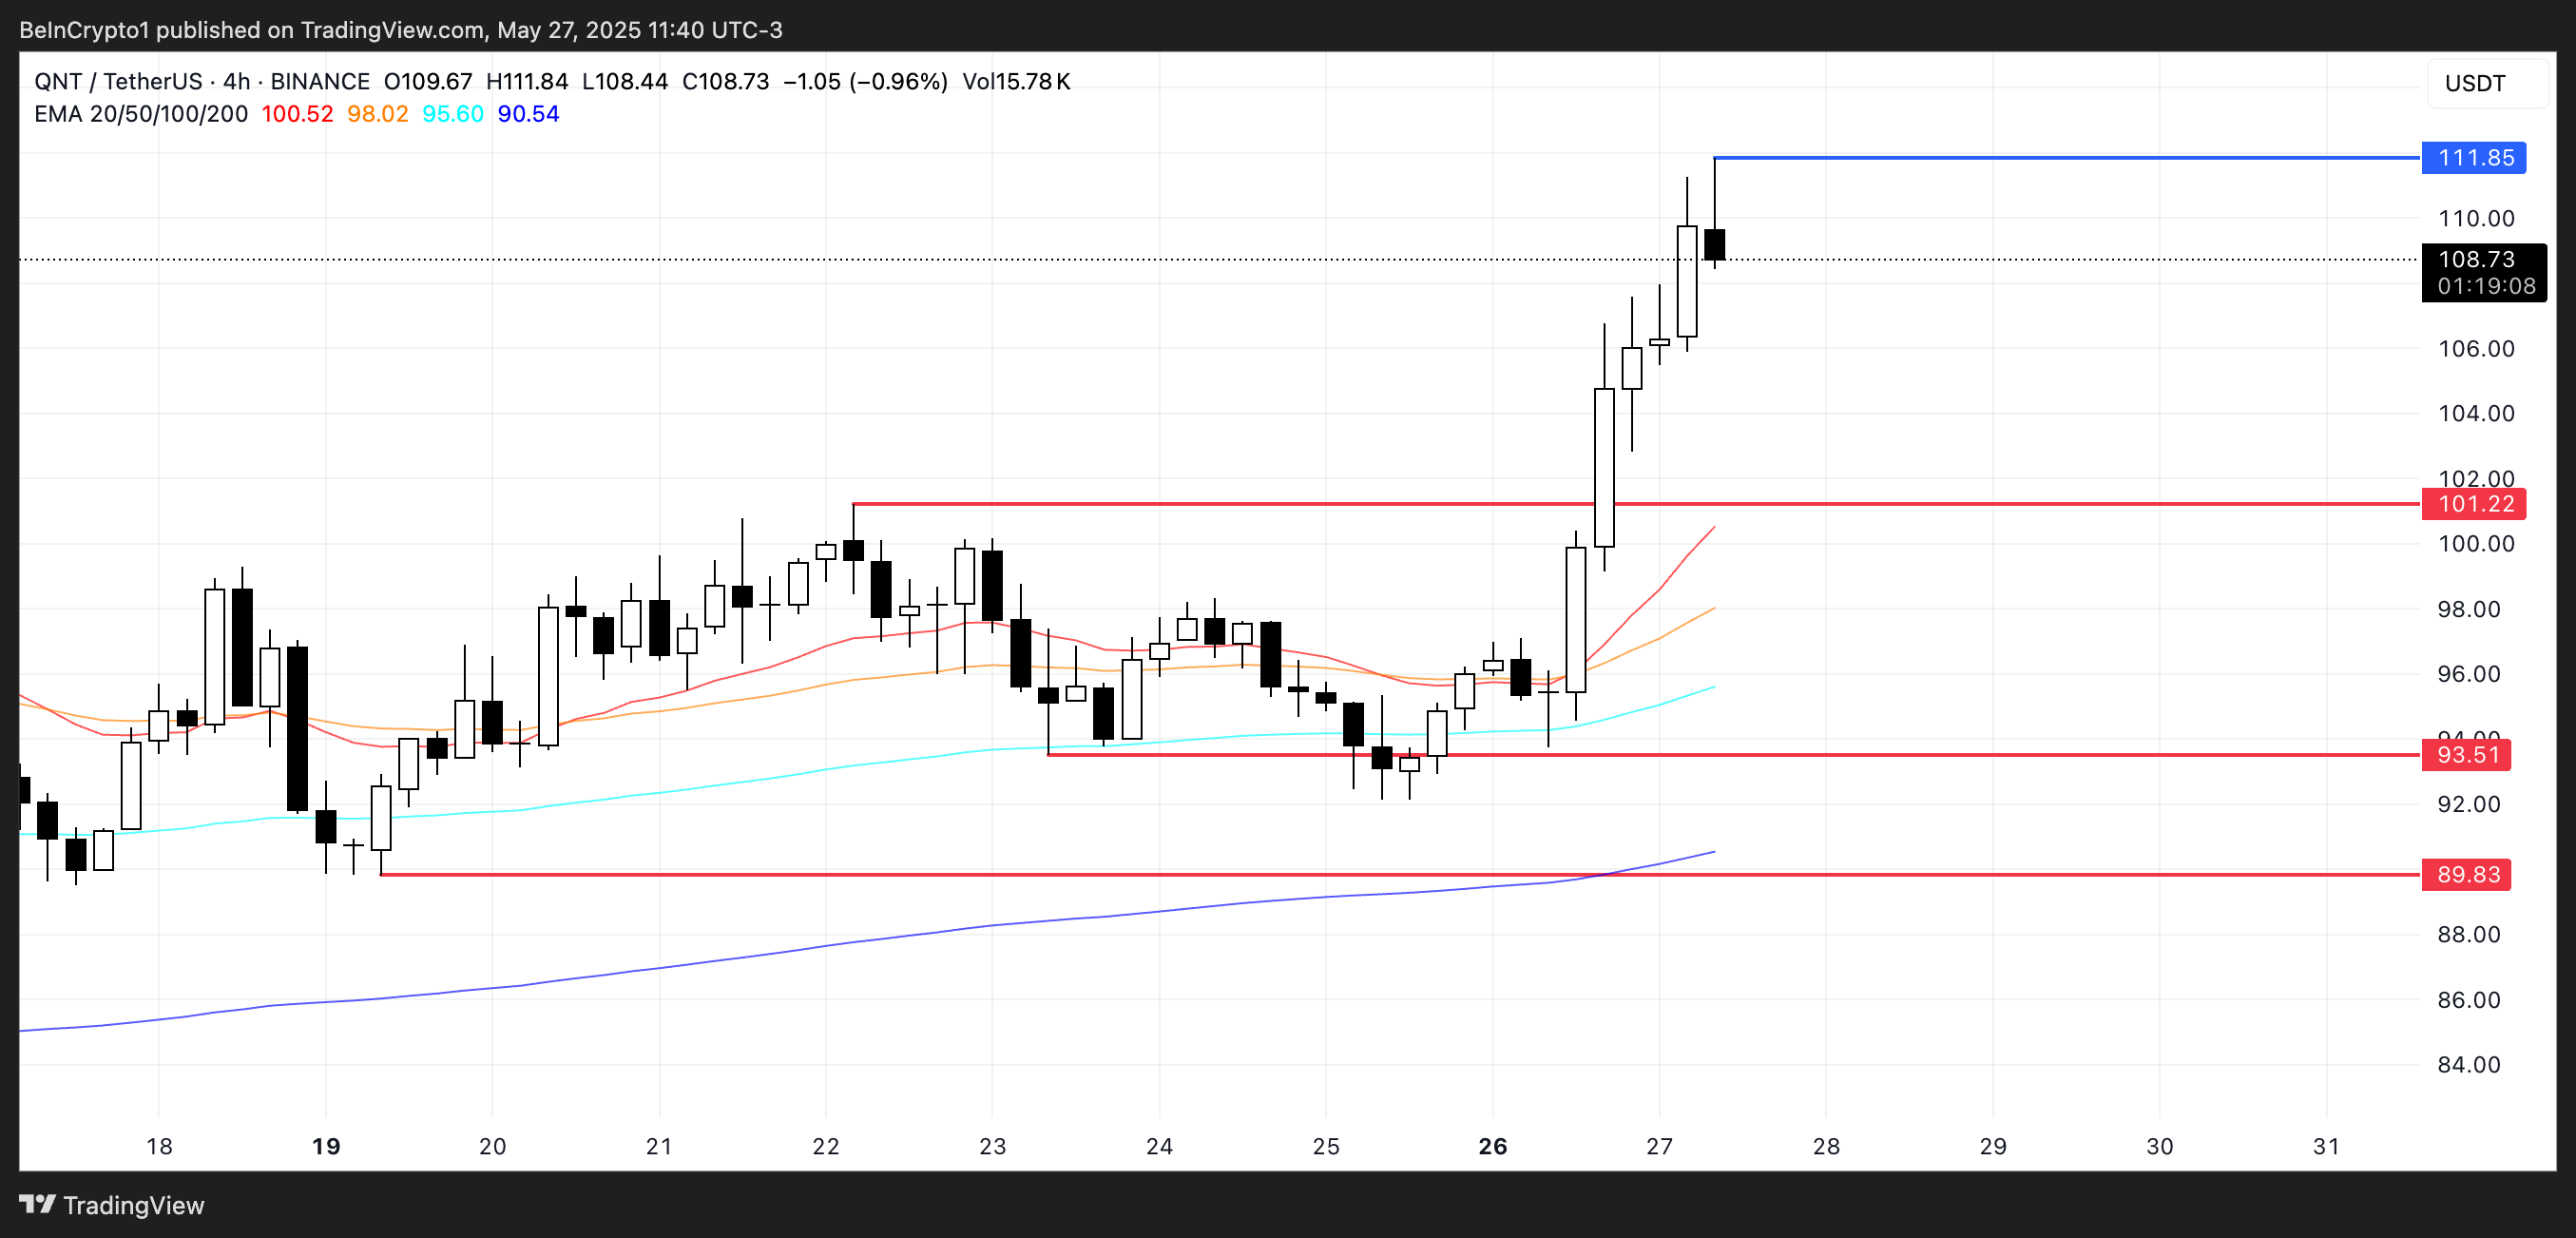 QNT Price Analysis. Source:
TradingView.
QNT Price Analysis. Source:
TradingView.
However, if momentum fades and the trend reverses, the first major support sits at $101.22.
A break below that level could trigger deeper losses, potentially dragging QNT down to $93.51.
If selling pressure intensifies, a further drop toward $89.93 can’t be ruled out.
Disclaimer: The content of this article solely reflects the author's opinion and does not represent the platform in any capacity. This article is not intended to serve as a reference for making investment decisions.
You may also like
New spot margin trading pair — HOLO/USDT!
FUN drops by 32.34% within 24 hours as it faces a steep short-term downturn
- FUN plunged 32.34% in 24 hours to $0.008938, marking a 541.8% monthly loss amid prolonged bearish trends. - Technical breakdowns, elevated selling pressure, and forced liquidations highlight deteriorating market sentiment and risk-off behavior. - Analysts identify key support below $0.0080 as critical, with bearish momentum confirmed by RSI (<30) and MACD indicators. - A trend-following backtest strategy proposes short positions based on technical signals to capitalize on extended downward trajectories.

OPEN has dropped by 189.51% within 24 hours during a significant market pullback
- OPEN's price plummeted 189.51% in 24 hours to $0.8907, marking its largest intraday decline in history. - The token fell 3793.63% over 7 days, matching identical monthly and yearly declines, signaling severe bearish momentum. - Technical analysts cite broken support levels and lack of bullish catalysts as key drivers of the sustained sell-off. - Absence of stabilizing volume or reversal patterns leaves the market vulnerable to further downward pressure.

New spot margin trading pair — LINEA/USDT!