
XRP price approaching critical support: a technical analysis deep dive

XRP is approaching a major high time frame support zone near the $2 mark. This level has consistently acted as a structural base for the past few months, holding up price action during several corrections. Now, with price once again pressing into this zone, the reaction from this level will likely determine whether XRP continues within its broader bullish structure or risks a deeper correction.
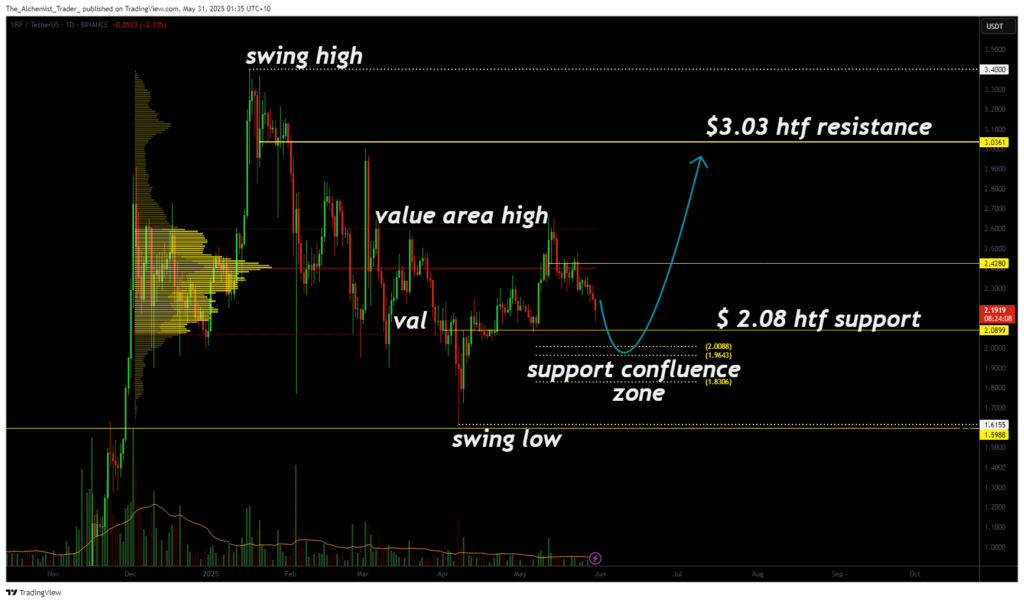
Price action remains rotational. XRP ( XRP ) has traveled from the value area high down toward the value area low, creating a textbook auction cycle between key volume levels. This movement has coincided with declining volume, a common precursor to volatility. From a technical standpoint, this setup may be the beginning of a new leg higher—if the market confirms support and volume increases.
Key technical points
- $2 High Time Frame Support Zone: Strong confluence of the 0.618 Fibonacci retracement and the value area low makes this zone a major technical demand area.
- Liquidity Cluster Below $2: Resting liquidity just beneath support suggests the possibility of a sweep before a reversal, often used by market makers to trap late sellers.
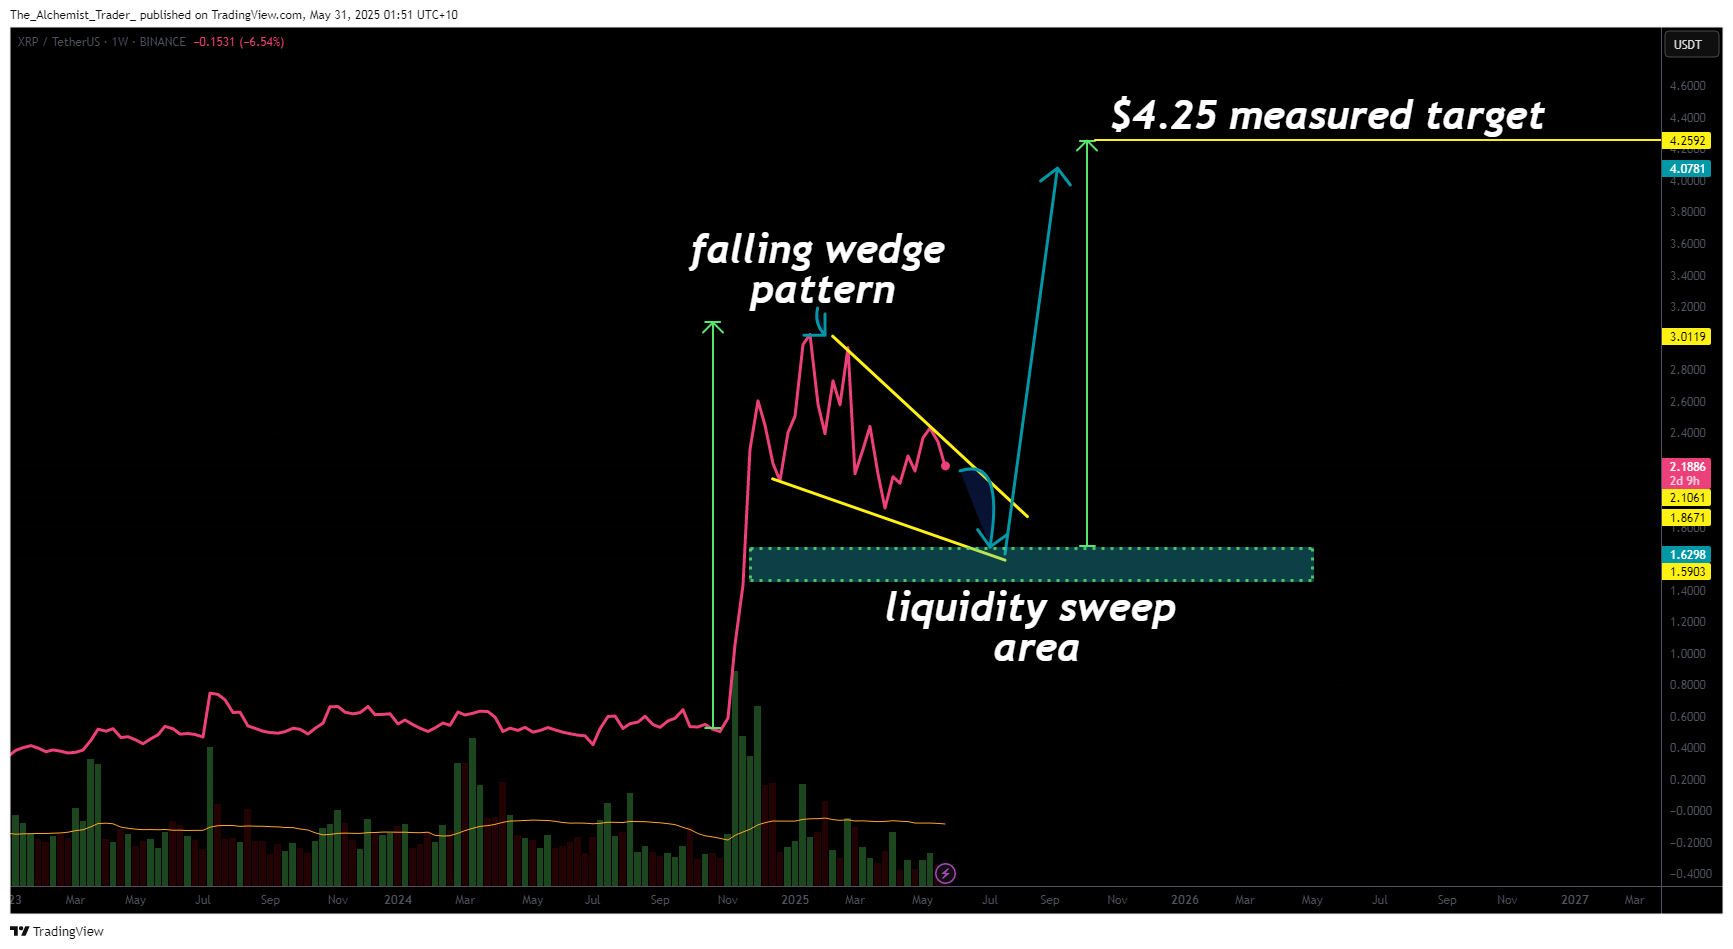
- Bullish Falling Wedge Formation: Price is coiling within a falling wedge pattern. A breakout from this structure projects a move toward $4.25.
- RSI Flattening at Midline: Relative Strength Index is stabilizing near the 40–50 range, hinting at momentum resetting and potential upside from oversold conditions.
- Volume Profile Contraction: A significant drop in trading volume shows compression. An influx of volume near support may ignite the breakout and rotation back toward higher resistance levels.
 XRPUSDT (1D) Chart, Source: TradingView
One important structural observation lies in XRP’s repeated defense of the $1.59 swing low—an area that also aligns with historical support and dynamic trendline reactions. If this level is breached with force, it would confirm a break in bullish market structure. However, if defended and followed by strong volume and a bullish reaction at or just below $2, this would validate a higher low and provide a strong launchpad for price to rotate higher.
From a market profile perspective, XRP’s recent price action has completed a full rotation: from the value area high near $3.10 down to the value area low near $2.00. Such moves typically reset liquidity and sentiment. The value area low is historically known to act as a springboard in trending environments. Combined with the falling wedge structure forming at this level, the conditions appear ideal for a breakout reversal.
 XRPUSDT (1H) chart, Source: TradingView
Price on lower time frames also presents important clues. XRP has formed a clean sequence of higher lows, suggesting that traders are positioning stops below the $2 region. This cluster of stop orders can create a liquidity pocket, which market makers often sweep to trigger reversals. If this occurs and the 0.618 golden pocket, just beneath the value area low, absorbs the move, a strong bounce becomes highly probable.
A deviation or liquidity sweep through $2 into the 0.618 level will need to be accompanied by increased buy-side volume to confirm a reversal. Traders should watch for a sharp wick below $2 followed by a swift reclaim of that level on higher volume. That would be a classic bullish deviation, an ideal entry signal for many swing traders.
 XRPUSDT (1W) Chart, Source: TradingView
Adding further weight to this setup is the falling wedge pattern, best visualized on the line chart. Falling wedges are typically bullish reversal formations, and XRP’s current wedge is narrowing near a key support region. The measured move from this wedge, calculated from the widest point of the pattern—projects a price target of approximately $4.25. This level also aligns with previous macro resistance zones from past bullish rallies.
Market sentiment is also showing early signs of a shift. Open interest is rising slightly, while funding rates remain neutral, suggesting neither over-leveraged longs nor shorts are dominating the market. This neutral backdrop gives more credibility to a breakout holding once triggered, as price won’t be fighting against extreme positioning.
The current risk-to-reward scenario for bulls is compelling. As long as price holds the $1.59 swing low and reclaims $2 support on strength, the bullish structure remains valid. A confirmed breakout of the falling wedge pattern could send XRP back toward $2.42 initially, then toward the $3 mark, with the full measured move targeting the $4.25 region.
What to expect in the coming price action
XRP is trading at a pivotal support region. A sweep below $2 into the golden pocket may act as a bullish trigger if followed by strong volume and a reclaim of the level. Watch for a breakout of the falling wedge pattern, which could send price toward $2.42 and eventually $4.25. If bulls fail to defend $1.59, the structure would be at risk, but for now, all signs suggest the market is coiling for a significant move higher.
Disclaimer: The content of this article solely reflects the author's opinion and does not represent the platform in any capacity. This article is not intended to serve as a reference for making investment decisions.
You may also like
Research Report|In-Depth Analysis and Market Cap of Meteora(MET)

Gold market cap soars to $30T, dwarfing Bitcoin and tech giants
Bitcoin hits 15-week low under $105K as US regional bank woes echo 2023
Top Trader on Hyperliquid Shorts $359K in Bitcoin