

After stalling beneath key resistance levels for much of the previous week, the Ethereum price today has once again slipped into a corrective mode, triggering concerns of renewed downside. As of writing, Ethereum price is trading near $2,481, down over 2% in the last 24 hours. This drop comes after repeated failures to break above the $2,580–$2,600 supply zone, with price gradually compressing under a descending resistance trendline.
What’s Happening With Ethereum’s Price?
 ETH/USD price dynamics (Source: TradingView)
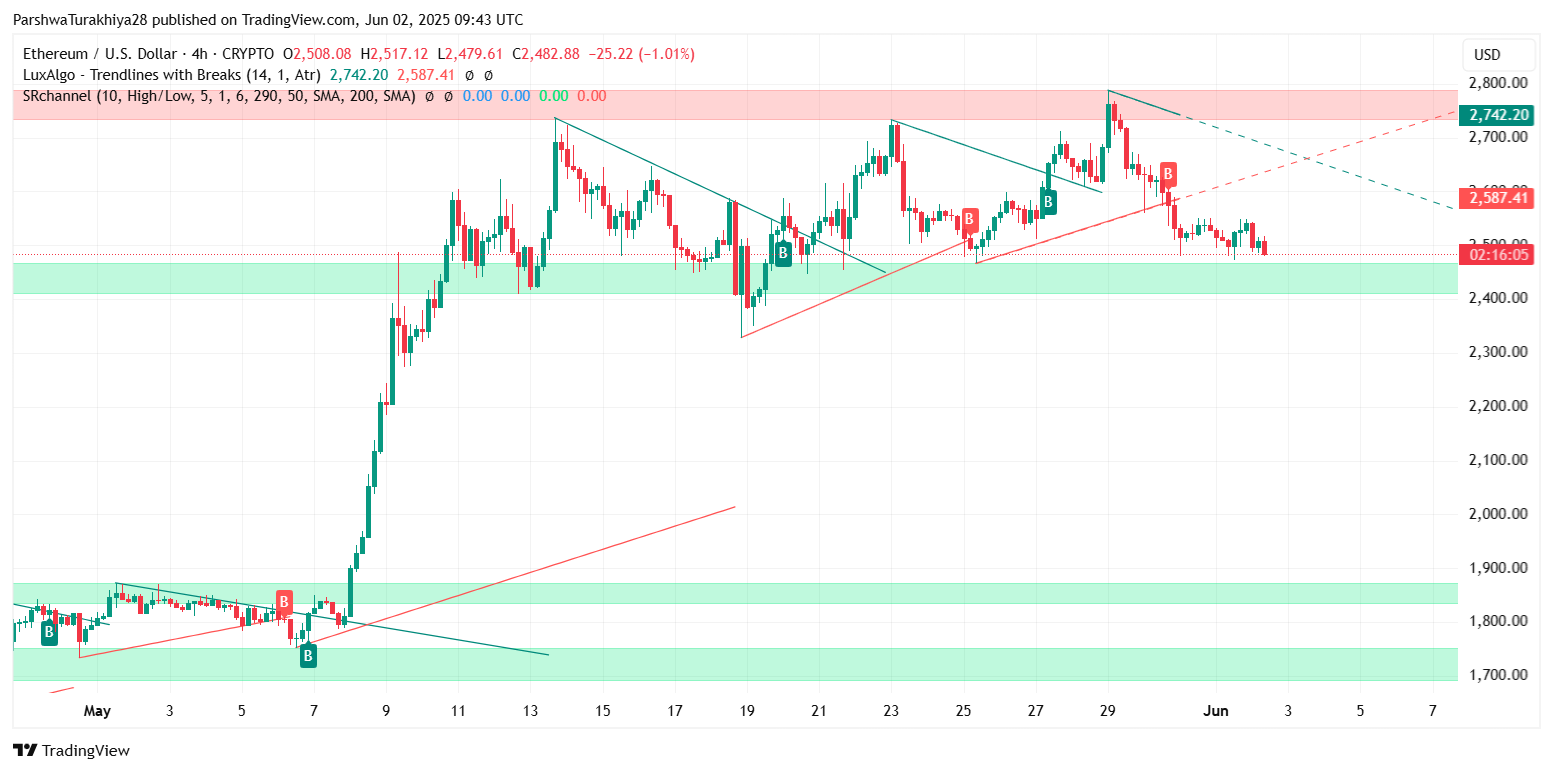
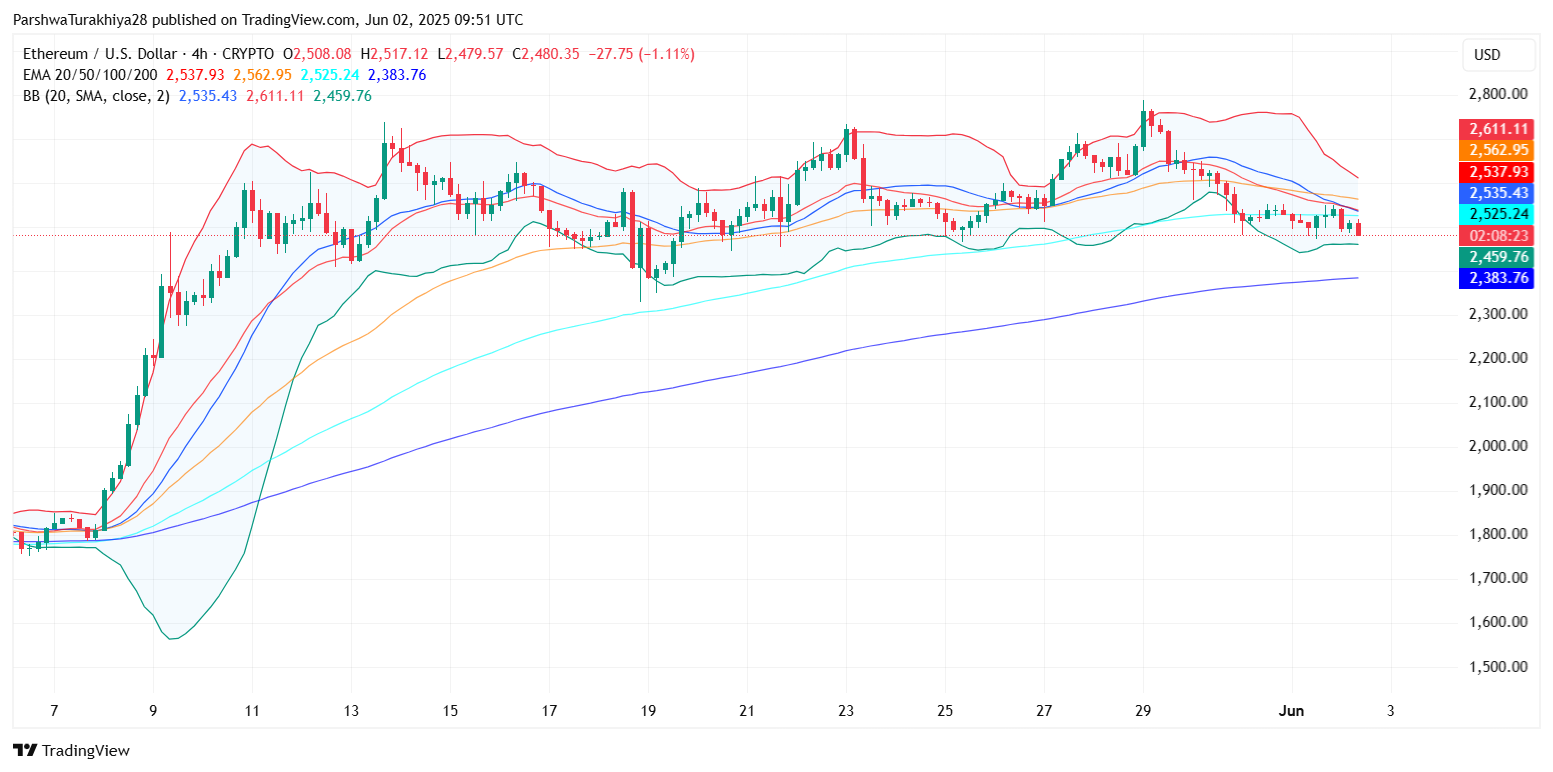
On the 4-hour chart, Ethereum price action has decisively broken below a short-term ascending support line, confirming bearish continuation within a broader consolidation pattern. Price has moved back into the $2,460–$2,500 demand region, a critical area where bulls have previously defended short-term downside. However, recent momentum suggests waning buyer strength.
 ETH/USD price dynamics (Source: TradingView)
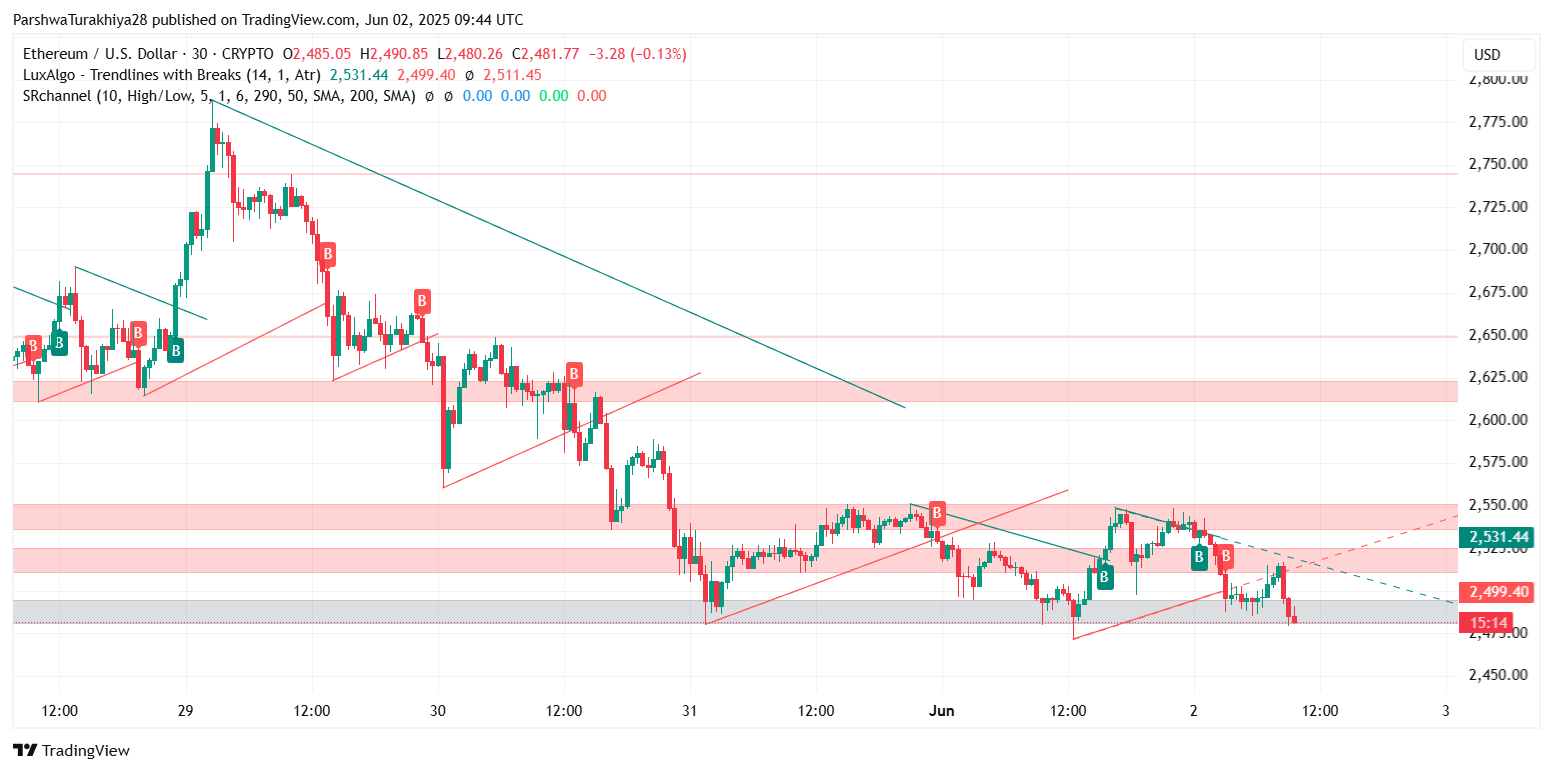
Multiple breakdown attempts since May 30 have kept ETH capped under the $2,530–$2,550 intraday resistance zone, with trendline pressure pushing price into tighter ranges. The chart structure now resembles a descending triangle, a typically bearish continuation formation that could gain traction if the $2,470 support level gives way.
RSI, MACD, and Stochastic Indicators Show Bearish Drift
 ETH/USD price dynamics (Source: TradingView)
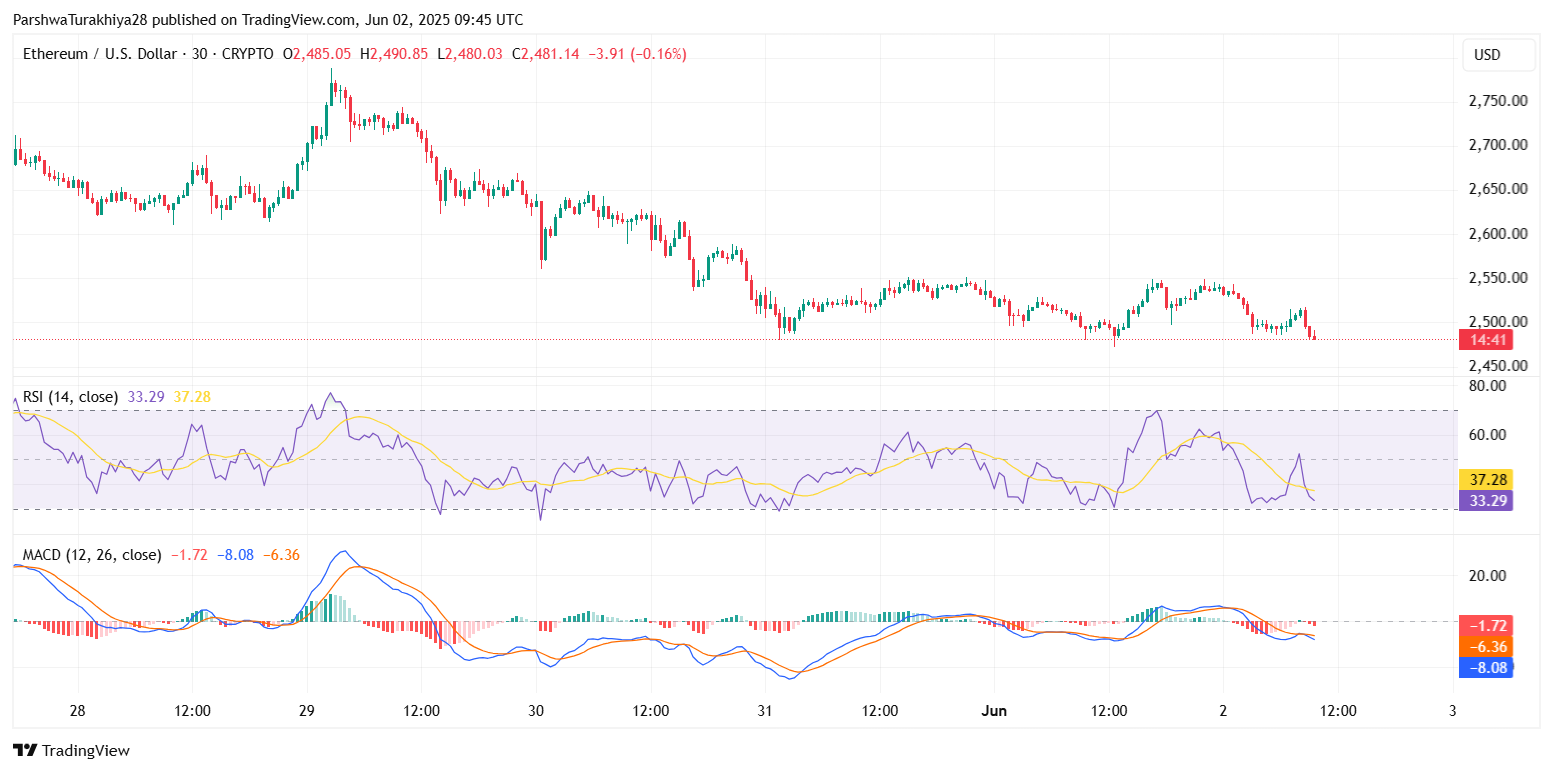
Momentum signals further confirm the cautious tone. On the 30-minute chart, RSI has dropped back near 33.29, suggesting Ethereum price volatility may expand if downside levels break. MACD histogram bars have turned red again, and the signal line crossover remains bearish, implying ongoing short-term selling pressure.
Meanwhile, the Stochastic RSI is oscillating in the lower bands, with a fresh bearish crossover below 20 on June 2—signaling that the asset is struggling to recover despite oversold conditions. If this pattern persists, ETH could continue to drift lower toward the $2,450 support zone, where historical bids have shown up in previous weeks.
Cloud Resistance and EMA Rejections Keep Upside Capped
 ETH/USD price dynamics (Source: TradingView)
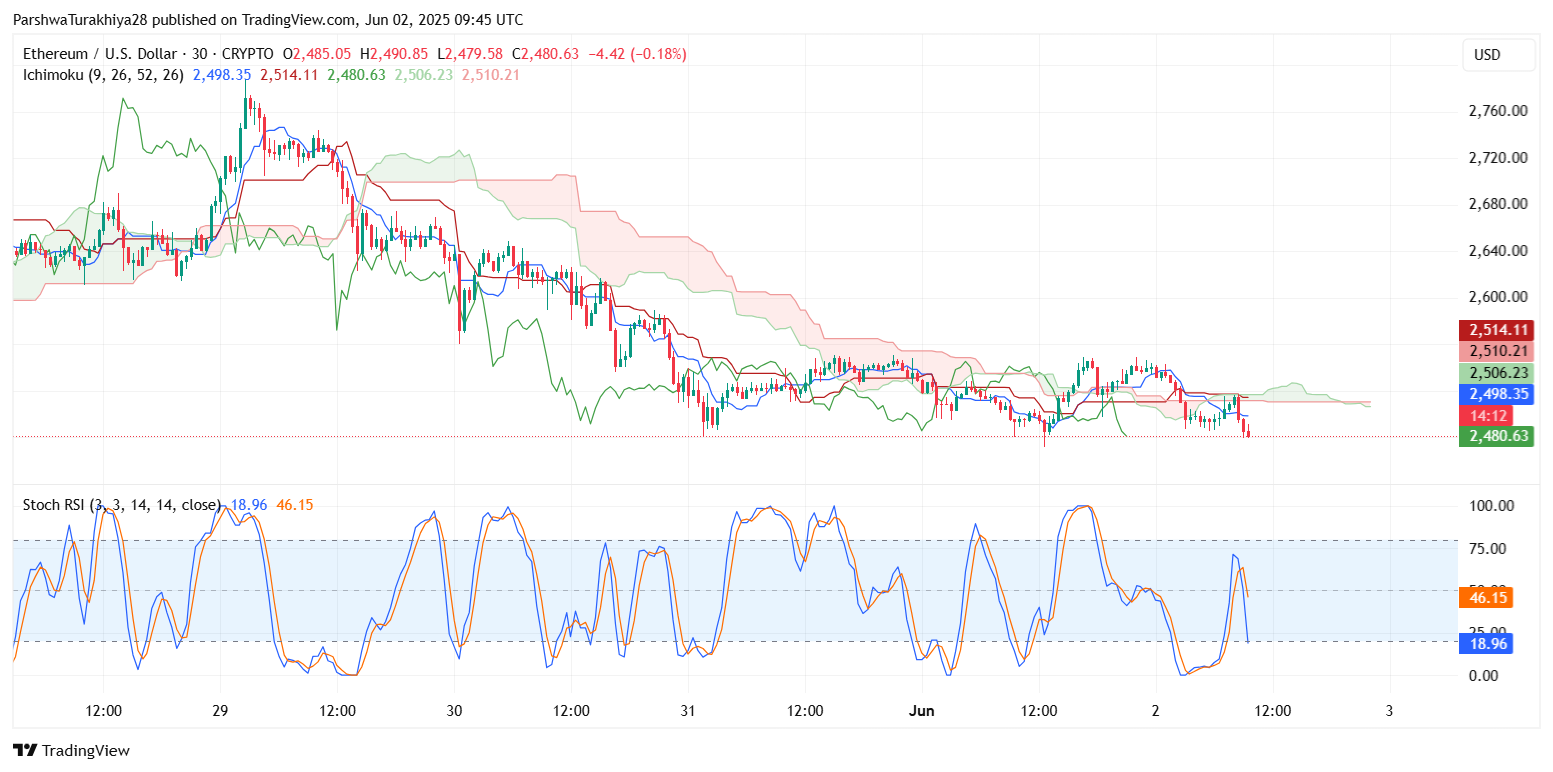
The Ichimoku Cloud on the 30-minute timeframe reinforces the bearish narrative. Price remains beneath the cloud with the baseline and conversion lines aligned above spot levels, reflecting strong resistance near $2,510–$2,520. This confluence has repeatedly repelled upward attempts over the past three sessions.
 ETH/USD price dynamics (Source: TradingView)
Adding to this, the 4-hour chart shows Ethereum price is currently pinned below all major exponential moving averages, including the 20, 50, and 100 EMA clusters near $2,525–$2,538. These dynamic resistance bands continue to weigh on any bounce attempts, keeping sentiment in a defensive stance for now.
Bollinger Bands also show a gradual contraction, with price hugging the lower band—a signal that volatility could increase sharply, potentially toward the lower support region near $2,420 if bears gain momentum.
Weekly Fibonacci and Structure Outlook
 ETH/USD price dynamics (Source: TradingView)
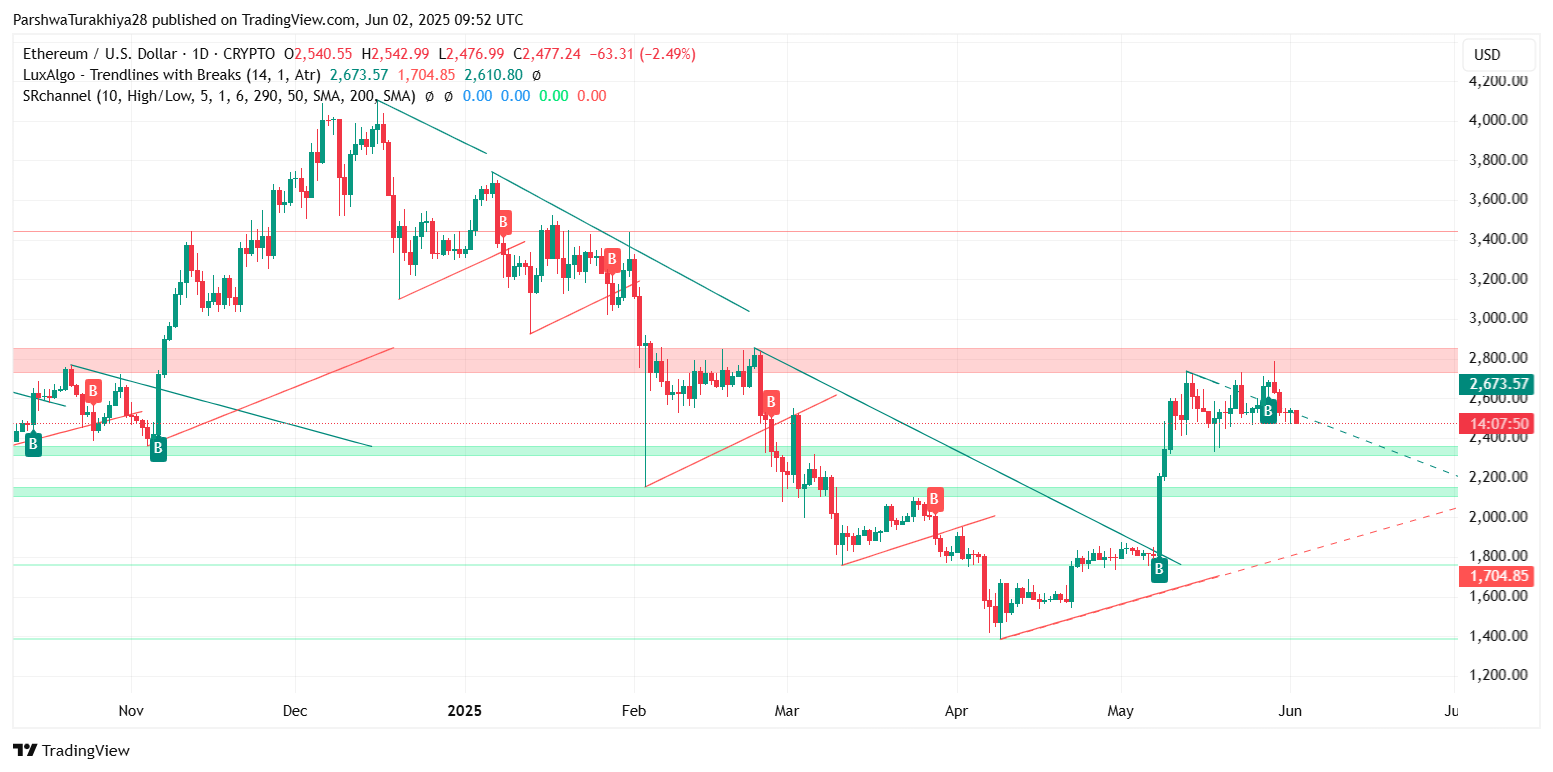
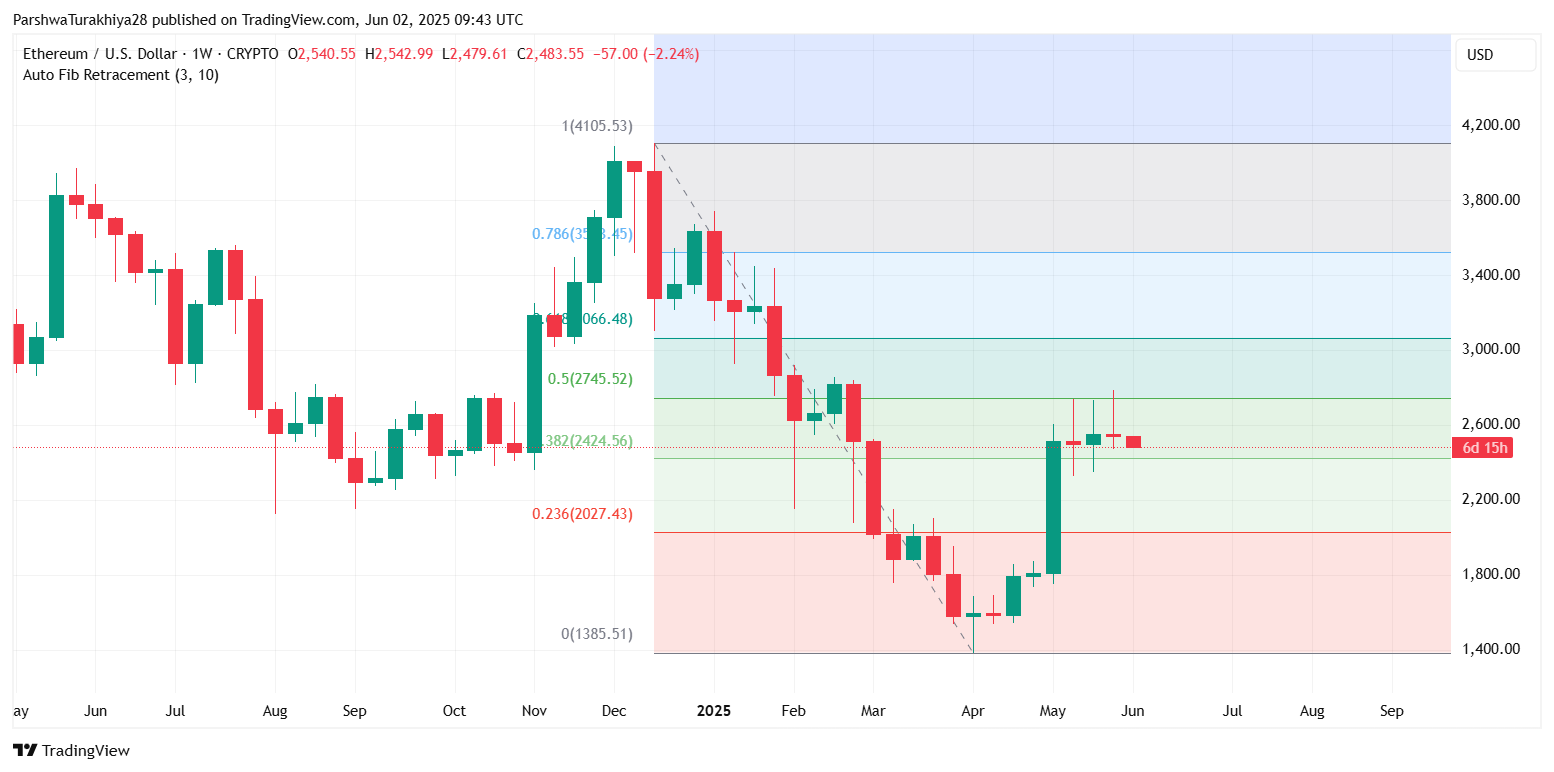
Zooming out to the weekly chart, the broader structure suggests that ETH remains trapped between the 0.382 and 0.5 Fibonacci levels, spanning $2,425–$2,745. This mid-Fibonacci compression is typically a battleground zone, and the inability to break through $2,745 (0.5 Fib) over the past few weeks signals broader consolidation.
A decisive breakout above the $2,580–$2,600 ceiling is needed to validate any renewed bullish breakout attempt. Until then, Ethereum price update remains range-bound, with a bearish tilt due to the descending triangle pressure and weakening momentum signals.
Short-Term Forecast: Can ETH Hold $2,450?
 ETH/USD price dynamics (Source: TradingView)
The question now is: Why is the Ethereum price going down today? The answer lies in the repeated rejection from dynamic resistance levels and fading momentum on multiple timeframes. Unless buyers can reclaim $2,530 with strong volume, the risk of further downside remains elevated.
In the near term, watch the $2,470–$2,450 zone closely. If this floor fails, ETH may quickly slide toward the $2,420–$2,400 support band. On the flip side, a bounce from current levels and a break above $2,530 could lead to a short-term relief push toward $2,580 and eventually $2,600.
Ethereum (ETH) Price Forecast Table
| Timeframe | Support Levels | Resistance Levels | Indicators |
| 30-min chart | $2,450 / $2,420 | $2,510 / $2,530 | RSI near 33, MACD bearish, Stoch RSI weak |
| 4-hour chart | $2,460 / $2,400 | $2,537 / $2,562 | Price below EMA cluster and Bollinger base |
| Daily chart | $2,425 (Fib 0.382) | $2,745 (Fib 0.5) | Consolidation within Fib midrange zone |
The Ethereum price today is struggling to maintain bullish structure as multiple rejections from resistance zones continue to weigh on price. Until a clean break above $2,580 occurs, bears remain in control. For now, eyes remain on the $2,450–$2,470 zone, which may dictate the next major directional move in the days ahead.
Disclaimer: The information presented in this article is for informational and educational purposes only. The article does not constitute financial advice or advice of any kind. Coin Edition is not responsible for any losses incurred as a result of the utilization of content, products, or services mentioned. Readers are advised to exercise caution before taking any action related to the company.

