

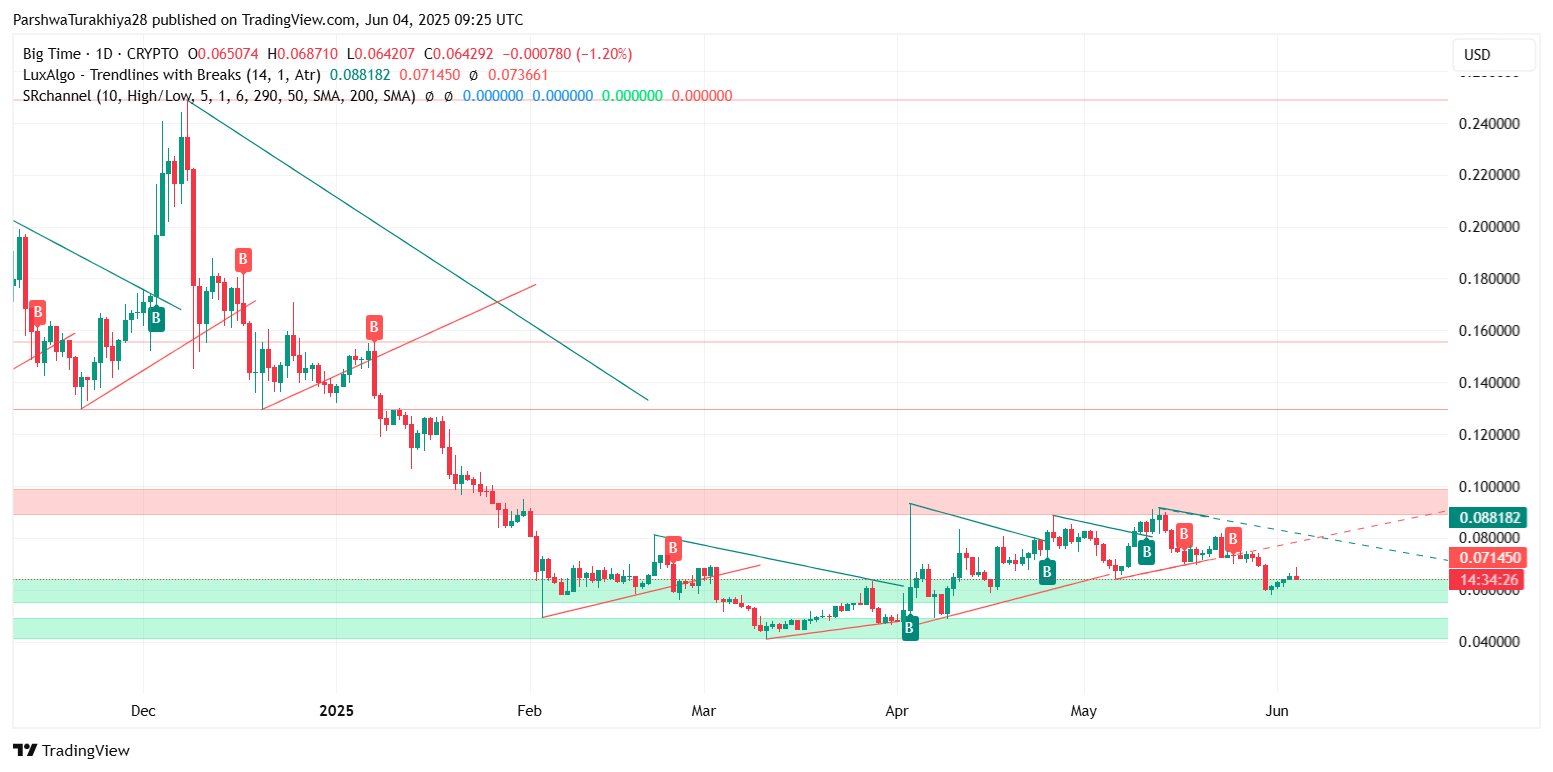
The Big Time price today is hovering around $0.0642, marking a modest recovery from the early June dip that briefly tested the $0.0610 zone. Despite reclaiming short-term support levels, the asset remains in a broader downtrend structure on the daily chart, with bearish pressure lingering beneath descending resistance lines and multiple red supply zones.
 BIGTIMEUSD price dynamics (Source: TradingView)
The outlook for June 2025 hinges on whether bulls can generate enough momentum to break out of this compression range or whether another leg lower is on the horizon.
Sideways Price Action Emerges Below Key Resistance Band
 BIGTIMEUSD price dynamics (Source: TradingView)
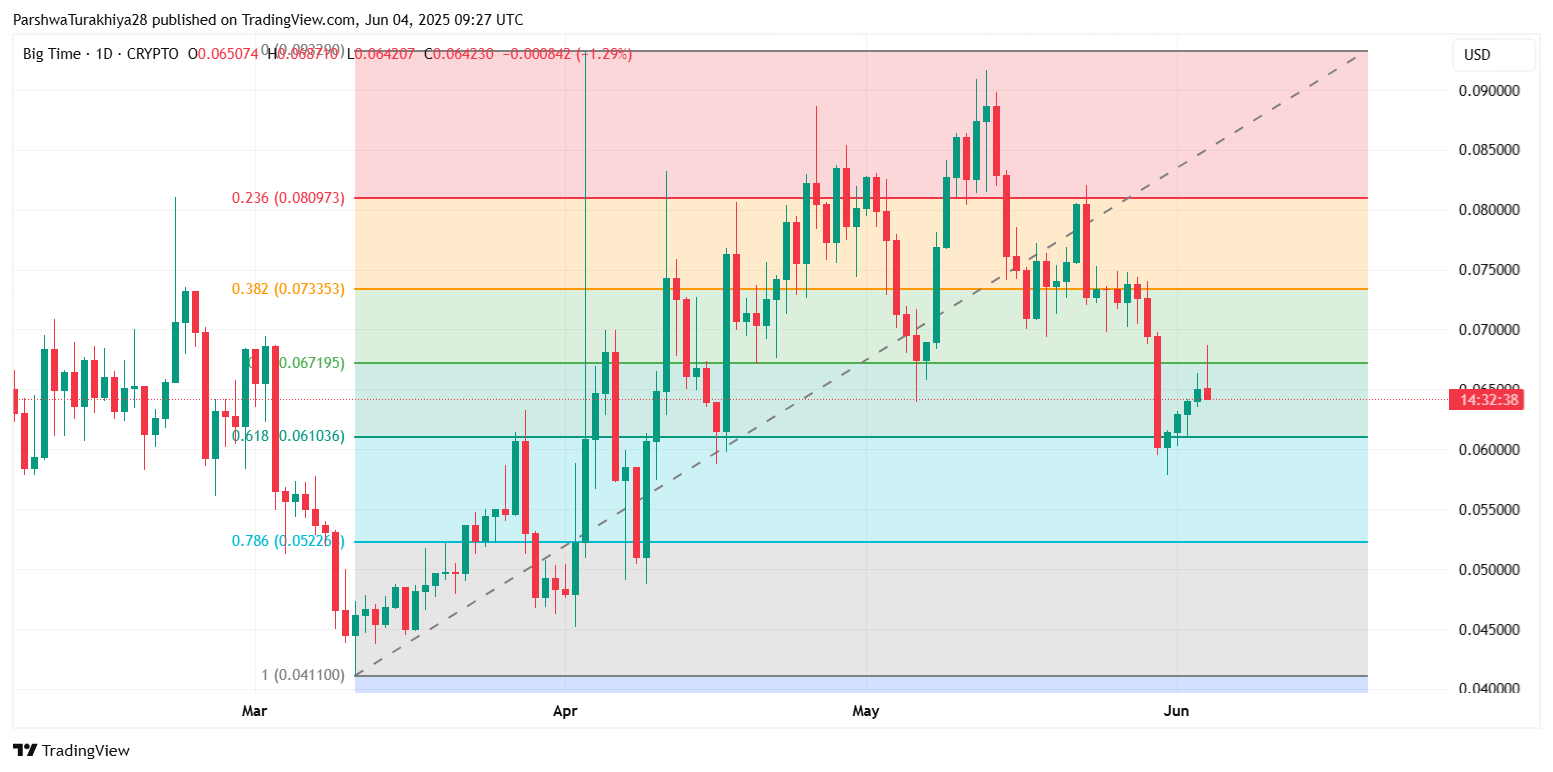
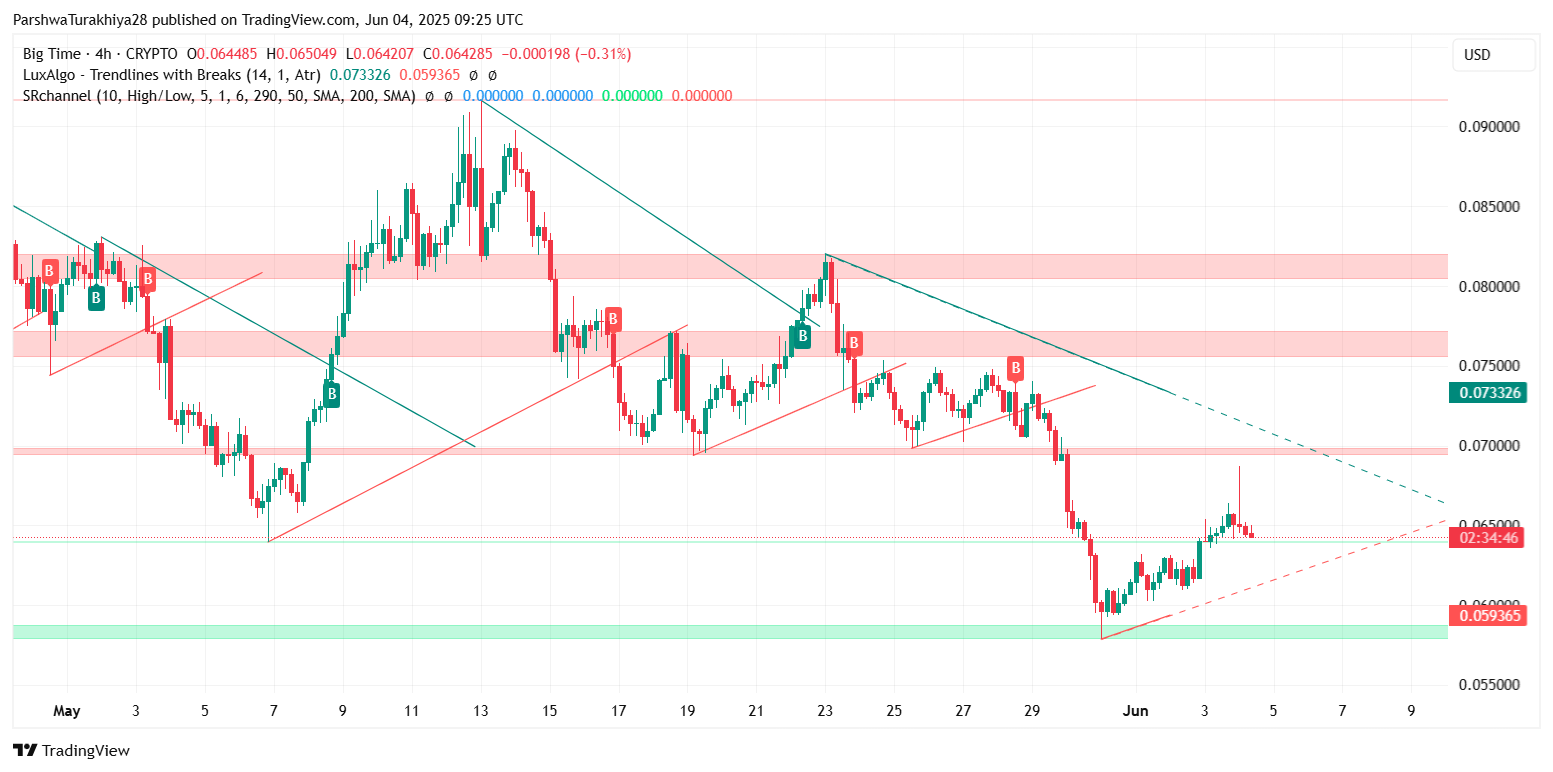
The 4-hour and daily charts show Big Time price action consolidating within a wedge pattern. Price is currently sandwiched between resistance at $0.0662 and support near $0.0610. This range overlaps with the 38.2% and 61.8% Fibonacci retracement levels from the March-to-May rally, making these zones critical.
 BIGTIMEUSD price dynamics (Source: TradingView)
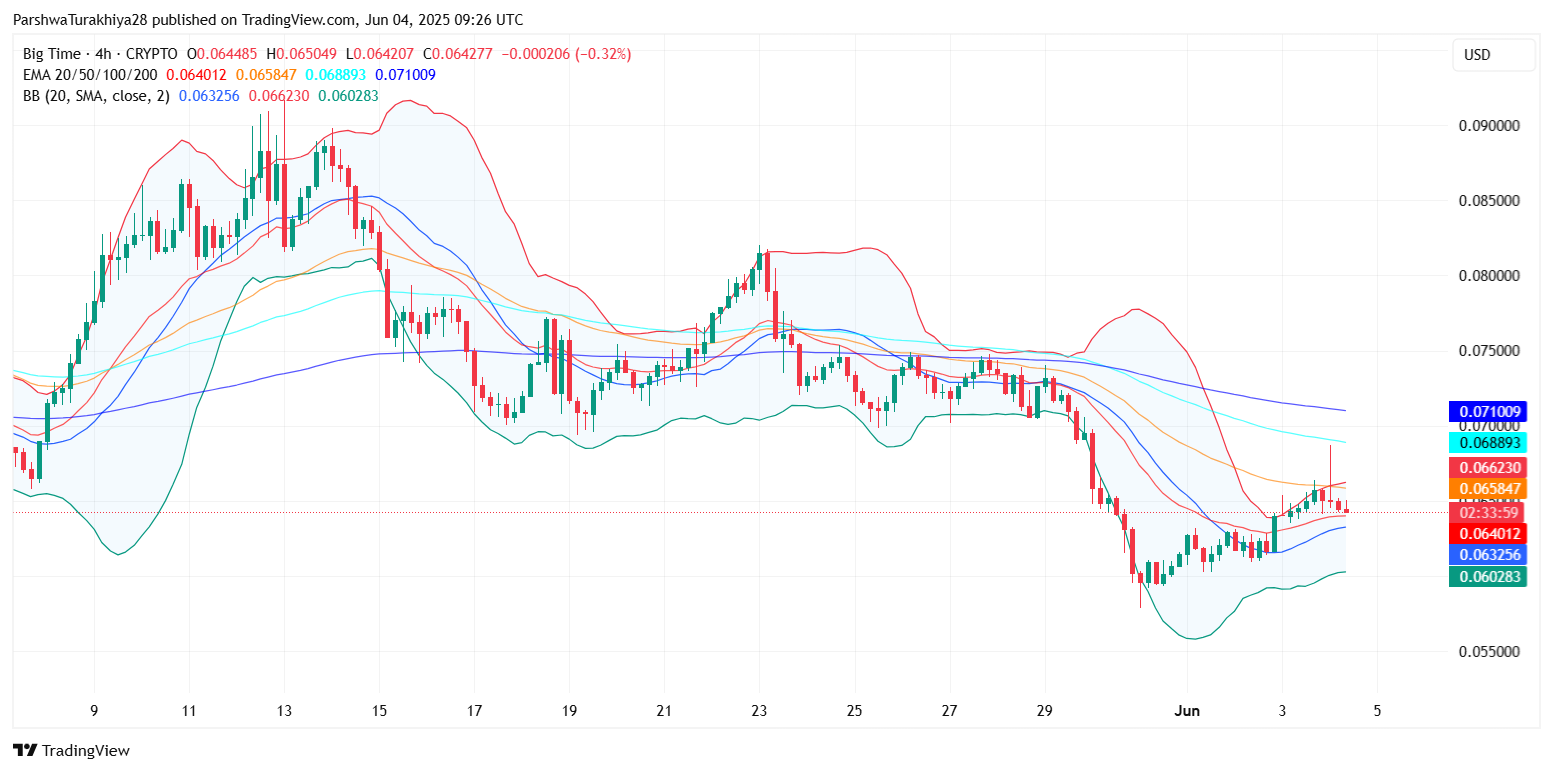
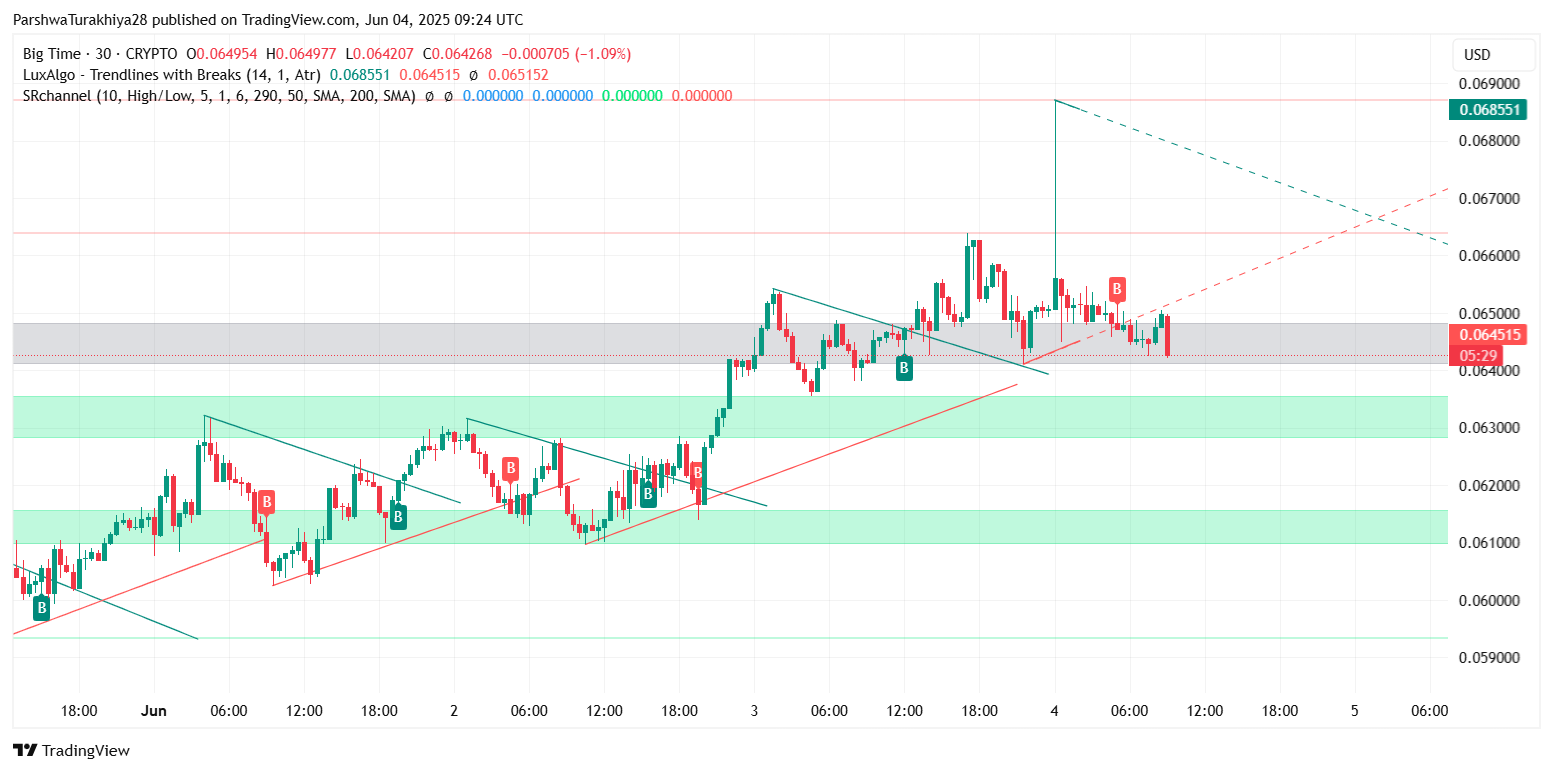
Despite a brief surge to $0.0685 on June 3, candles failed to hold above the resistance zone and were quickly pushed back into the channel. On the 30-minute and 4-hour timeframes, candles are tightly compressed within narrowing Bollinger Bands, pointing to reduced Big Time price volatility and a likely breakout setup in the coming sessions.
However, the price remains below the 200 EMA ($0.0710) and is trading near the EMA20–EMA50 cluster ($0.0640–0.0658). This convergence of moving averages is acting as dynamic resistance, capping upside attempts for now.
Indicators Flash Mixed Signals as Momentum Stalls
 BIGTIMEUSD price dynamics (Source: TradingView)
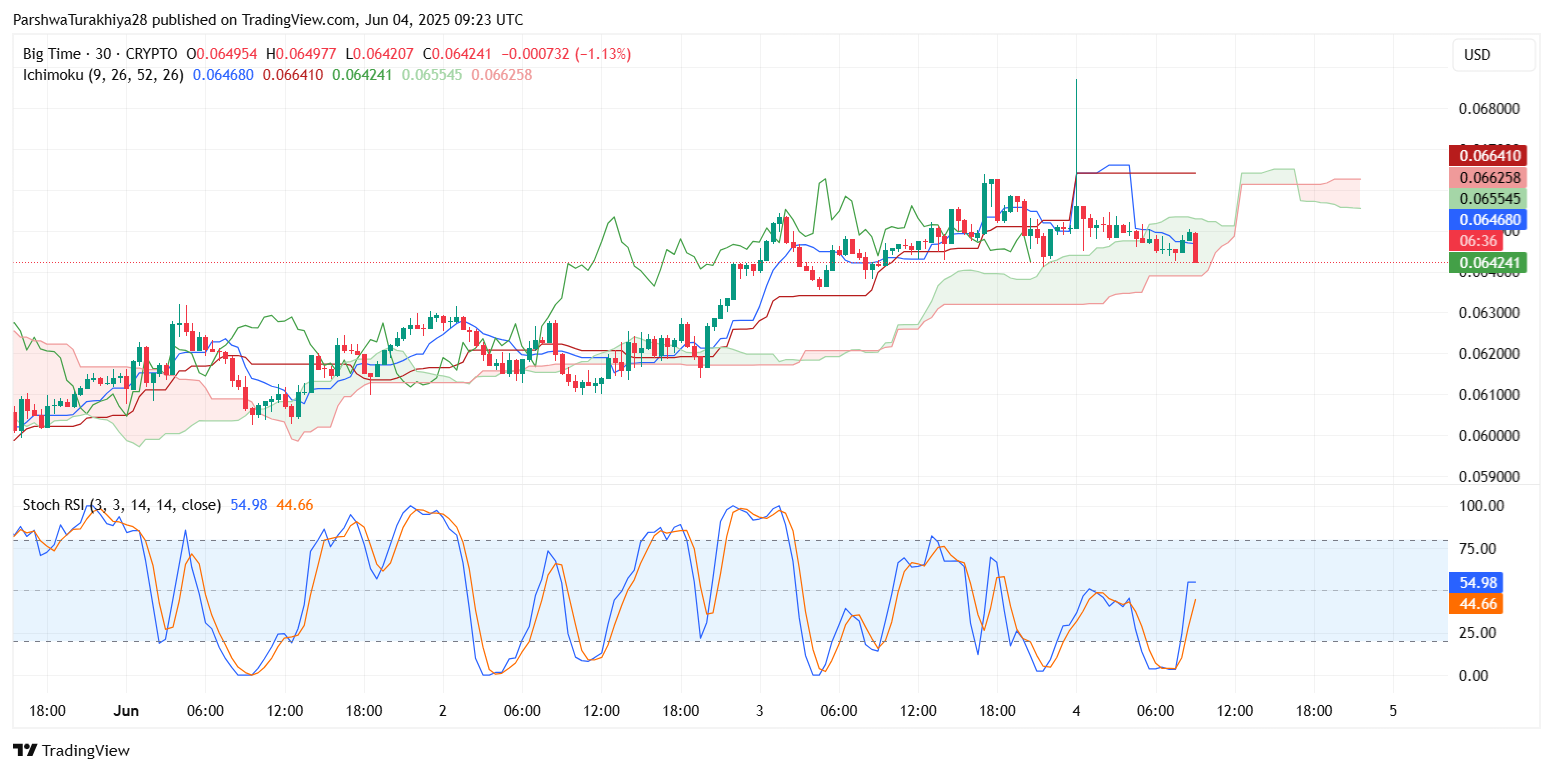
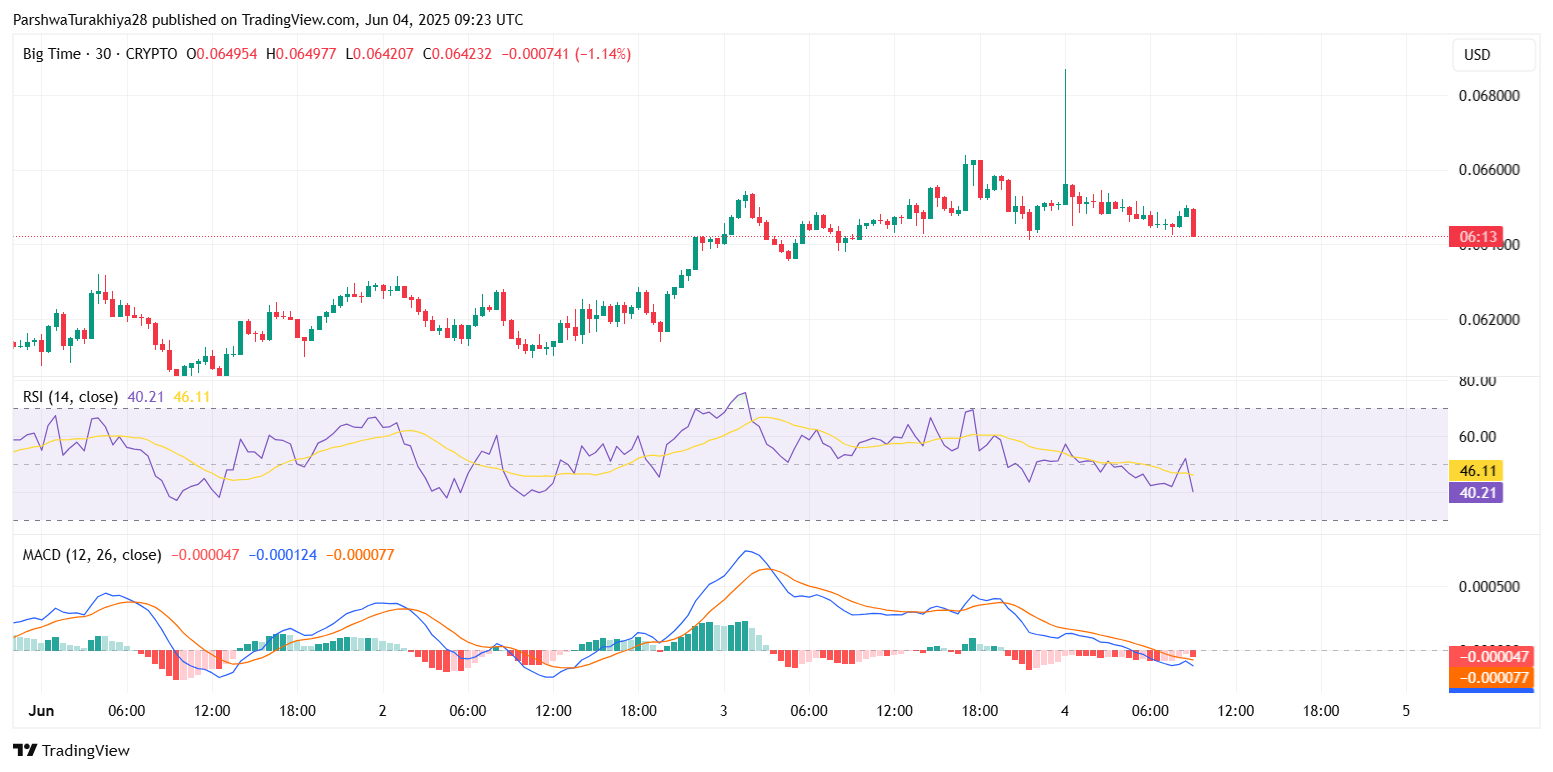
Short-term momentum indicators provide a neutral-to-bearish bias. The Stochastic RSI on the 30-minute chart is recovering from oversold territory (currently at 54.98 and 44.66), suggesting a possible intraday bounce. Yet, the RSI on the same chart is still weak at 40.21, indicating sellers are slightly more aggressive at current levels.
 BIGTIMEUSD price dynamics (Source: TradingView)
The MACD histogram has turned flat, while both MACD and signal lines hover near the zero mark. This combination implies indecision and reinforces the consolidation narrative. On the daily chart, Ichimoku Cloud analysis reveals that Big Time is trading within the cloud, with the Tenkan-Sen and Kijun-Sen lines showing limited directional momentum. A clear trend may only emerge once price decisively breaks above $0.0672 or below $0.0610 with volume confirmation.
Why Big Time Price Going Down Today? Range Traps and Low Volume
 BIGTIMEUSD price dynamics (Source: TradingView)
The main reason why Big Time price going down today lies in range exhaustion and declining buyer conviction. After failing to sustain above $0.0685, price action has consistently struggled to break the descending triangle structure visible on the 4-hour chart. The rejection near $0.0665–$0.0680 also aligns with prior supply zones marked in red, where liquidity tends to shift in favor of sellers.
Additionally, price has repeatedly tested the same support area near $0.061, indicating weakening bullish momentum. The low volume environment and flat MACD structures further validate this weakness. Without a catalyst, the odds favor a continued grind within this tightening pattern, with increasing risk of a downside break.
Big Time Short-Term Outlook for June 2025
 BIGTIMEUSD price dynamics (Source: TradingView)
Looking ahead, a decisive breakout above $0.0672 could open the door for a retest of the $0.0733 zone, followed by $0.0809 — both of which coincide with Fibonacci retracement levels and prior supply regions. On the downside, a break below $0.0610 would expose the $0.0593 and $0.0522 levels, with the latter being the 78.6% Fib retracement.
Until then, traders should watch for a breakout from the current compression triangle. If momentum shifts and volume spikes, the move could be sharp in either direction. However, in the current setup, a neutral-to-bearish outlook prevails unless the price reclaims $0.0685 with conviction.
BIGTIME Forecast Table: June 2025
| Technical Indicator / Zone | Value (USD) | Signal / Interpretation |
| Big Time price today | $0.0642 | Hovering near EMA cluster |
| Resistance 1 | $0.0662 | EMA50 + prior rejection zone |
| Resistance 2 | $0.0733 | 38.2% Fib retracement |
| Support 1 | $0.0610 | Key horizontal base |
| Support 2 | $0.0593 | Mid-May demand zone |
| RSI (30-min) | 40.21 | Bearish-neutral bias |
| Stochastic RSI | 54.98 / 44.66 | Recovering from oversold |
| MACD | Near zero | Flat, awaiting trigger |
| Bollinger Bands | Tightening | Volatility contraction |
| Trend Bias (Short Term) | Neutral-Bearish | Awaiting breakout from wedge |
Disclaimer: The information presented in this article is for informational and educational purposes only. The article does not constitute financial advice or advice of any kind. Coin Edition is not responsible for any losses incurred as a result of the utilization of content, products, or services mentioned. Readers are advised to exercise caution before taking any action related to the company.