
Solana Price Prediction: Can SOL Break $170 This Week?

Solana (SOL) price is starting the week strong , showing promising signs of recovery after a turbulent end to May. Based on the latest daily and hourly TradingView charts, SOL is attempting a breakout while fighting overhead resistance. With key moving averages tightening and bullish momentum visible, traders are watching closely to see if SOL price can extend toward the $170–$180 zone. Here's a breakdown of what the charts are telling us.
Solana Price Prediction: Is SOL Price Gearing Up for a Short-Term Rally?
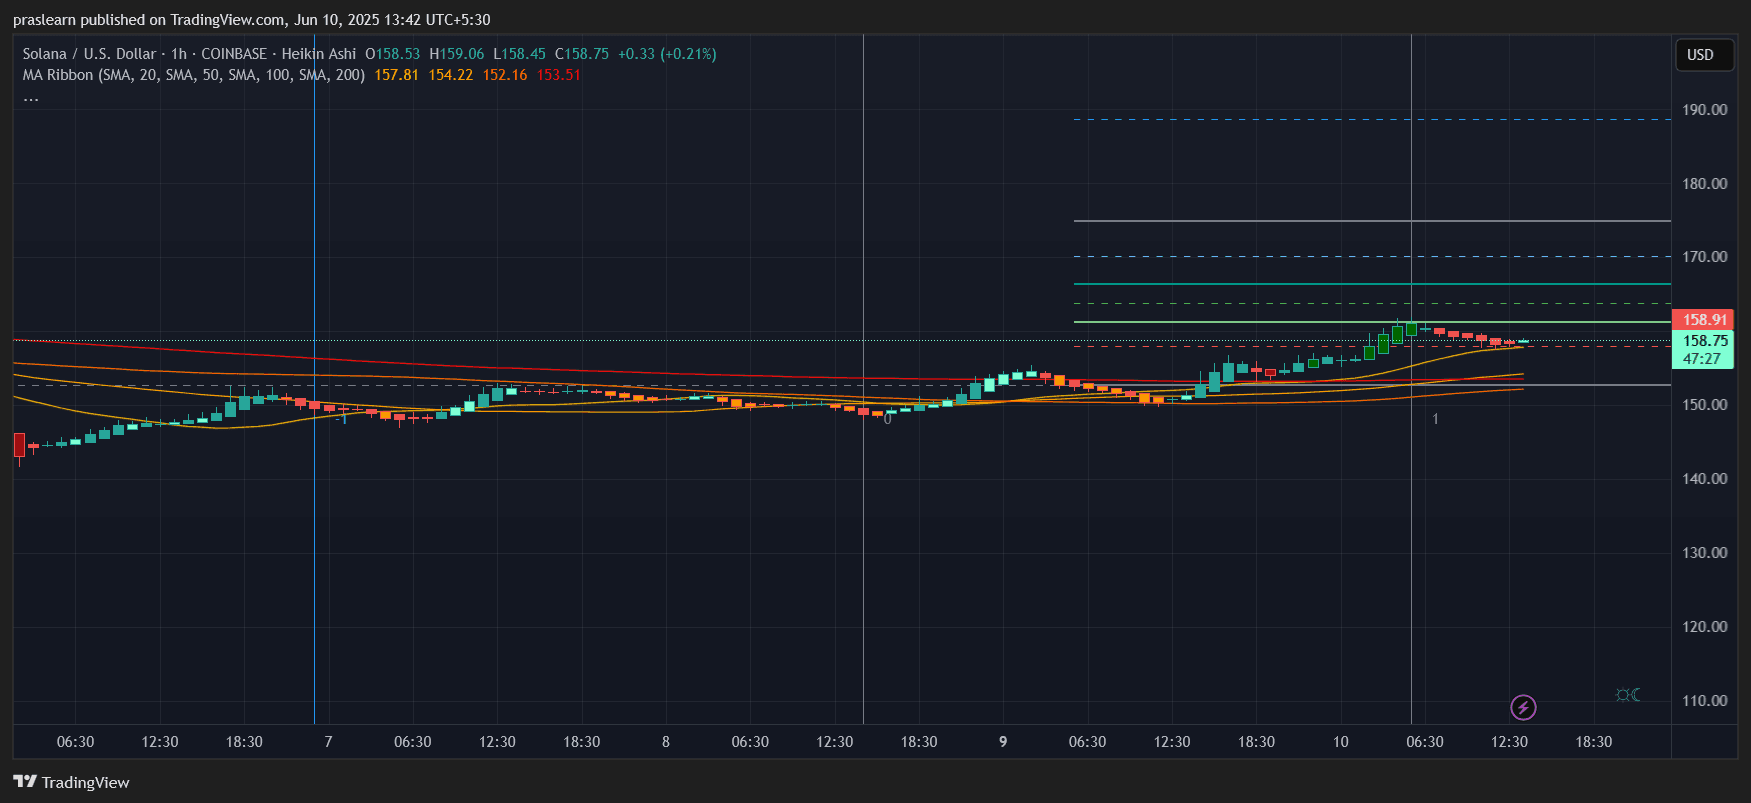 SOL/USD 1 Hr Chart- TradingView
The 1-hour chart for Solana price shows a clear bullish crossover on the MA Ribbon. The price is currently trading above the 20, 50, 100, and 200 SMAs, with the 200 SMA lagging behind at around $153.51. SOL is holding above this entire band, with the price at $158.75, indicating short-term bullish strength.
Notably, the Heikin Ashi candles are still printing green, but they are showing smaller bodies and longer upper wicks—suggesting a temporary slowdown in momentum. Still, the structure remains bullish unless SOL closes below the $153–$155 support zone. The Fibonacci levels show a near-term target around $165, followed by $172. Using the hourly chart’s base range of $150 to $158, a Fibonacci extension of 1.618 projects $171.65—well within striking distance if buying volume increases.
Is the Daily Chart Supporting a Bigger Breakout?
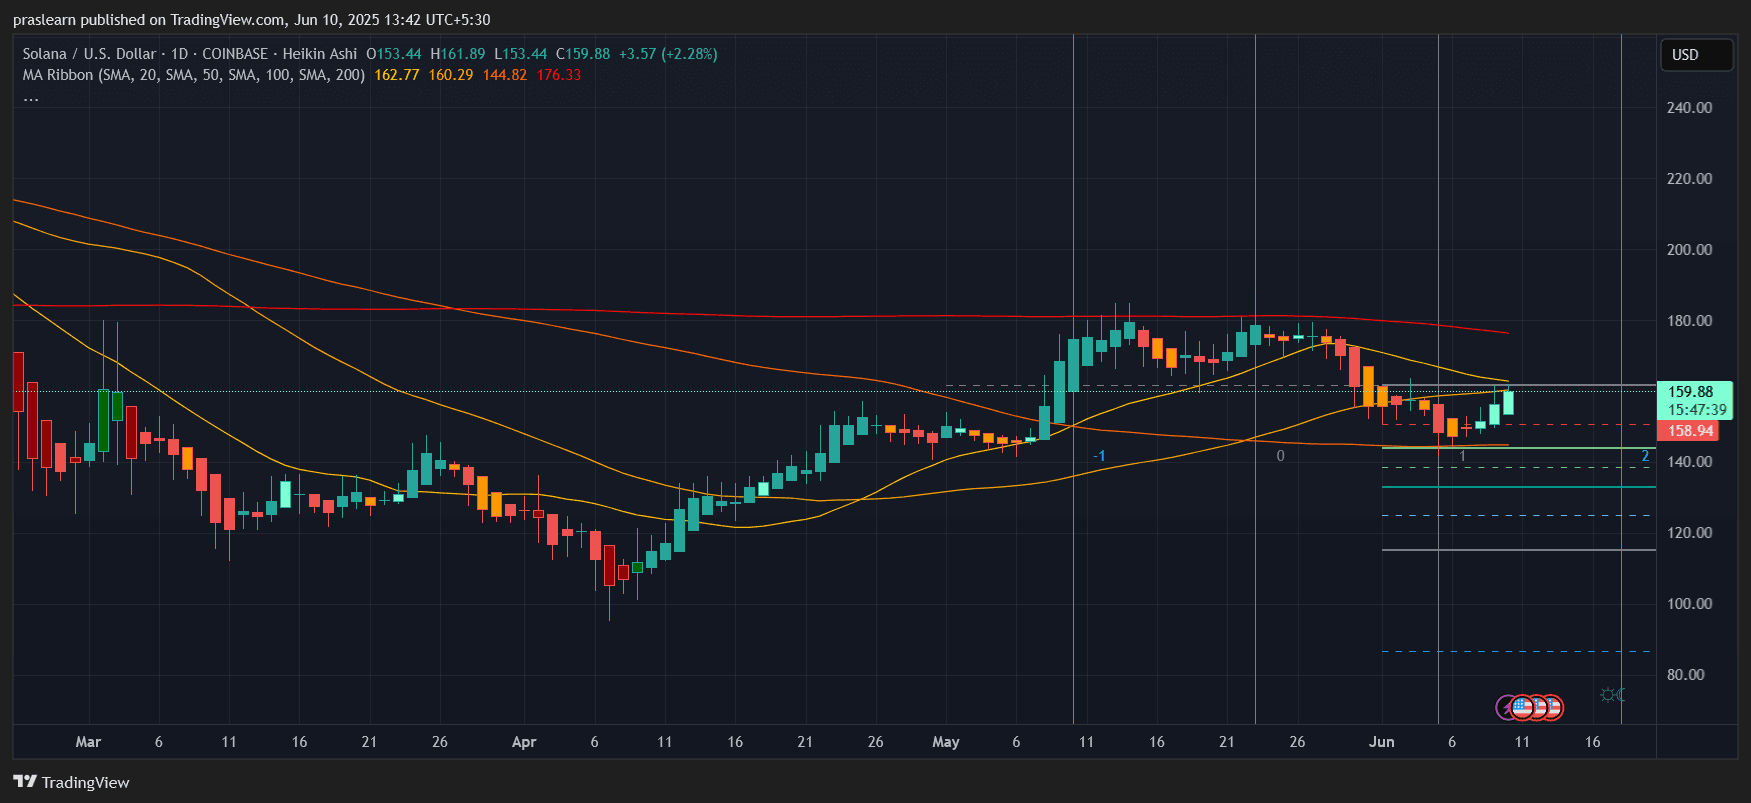 SOL/USD 1 Day Chart- TradingView
The daily chart reveals a stronger, more structural development. After falling from May highs near $188, SOL price found support at the 100 SMA ($144.82), which aligns with Fibonacci support levels. The recent bounce from that zone has pushed SOL back up to $159.88, with a daily gain of +2.28%.
Importantly, SOL price is now attempting to flip the 20-day SMA ($160.29) and 50-day SMA ($162.77) into support. This confluence creates a key battleground zone between $160–$163. A daily close above this range could attract a fresh wave of buyers. If that happens, the next target is the 200 SMA at $176.33.
Let’s do a quick calculation:
If Solana price maintains a $5 daily gain (as it did in the last 24 hours) and breaks $163 resistance by mid-week, then:
$159.88 + ($5 × 3 days) = $174.88 by Thursday, testing the 200 SMA and possibly triggering FOMO among swing traders.
What Are the Key Support and Resistance Levels to Watch?
- Immediate resistance sits at $160–$163, which includes short-term SMAs and recent price rejection zones. A successful breakout above this area opens up room toward $170 and then $176.
- Strong support lies near $144. If SOL price breaks below $152 (the 100-hour SMA zone), bears could regain control and push the price back to $140–$145. The long-term bullish thesis holds only if $140 remains intact as a base.
Solana Price Prediction: Will SOL Price Break $170 This Week?
There’s a decent probability. The hourly chart suggests a short-term bullish continuation, while the daily chart shows a larger pattern forming that could lead to a breakout if Solana price holds above the moving average cluster. The 20- and 50-day SMAs converging indicate that a “Golden Cross” setup could be near—a historically bullish signal.
Considering the momentum, Fibonacci targets, and moving average dynamics, a move toward $170–$175 is realistic by this weekend if BTC stays above $100K and broader crypto sentiment remains positive.
Final Thoughts
Solana price is not just recovering —it’s showing technical signs of strength across both short-term and mid-term timeframes. If buyers defend $155 and flip $160–$163 into support, we could be looking at a breakout week. Traders should closely monitor volume surges and 4-hour candle confirmations to ride this move.
If $160 holds, Solana price can rally to $171–$175 this week. However, a failure to maintain $153 could drag the SOL price back to $144. Risk is manageable, but momentum is clearly shifting toward the bulls.
$SOL, $Solana
Solana (SOL) price is starting the week strong , showing promising signs of recovery after a turbulent end to May. Based on the latest daily and hourly TradingView charts, SOL is attempting a breakout while fighting overhead resistance. With key moving averages tightening and bullish momentum visible, traders are watching closely to see if SOL price can extend toward the $170–$180 zone. Here's a breakdown of what the charts are telling us.
Solana Price Prediction: Is SOL Price Gearing Up for a Short-Term Rally?
SOL/USD 1 Hr Chart- TradingView
The 1-hour chart for Solana price shows a clear bullish crossover on the MA Ribbon. The price is currently trading above the 20, 50, 100, and 200 SMAs, with the 200 SMA lagging behind at around $153.51. SOL is holding above this entire band, with the price at $158.75, indicating short-term bullish strength.
Notably, the Heikin Ashi candles are still printing green, but they are showing smaller bodies and longer upper wicks—suggesting a temporary slowdown in momentum. Still, the structure remains bullish unless SOL closes below the $153–$155 support zone. The Fibonacci levels show a near-term target around $165, followed by $172. Using the hourly chart’s base range of $150 to $158, a Fibonacci extension of 1.618 projects $171.65—well within striking distance if buying volume increases.
Is the Daily Chart Supporting a Bigger Breakout?
SOL/USD 1 Day Chart- TradingView
The daily chart reveals a stronger, more structural development. After falling from May highs near $188, SOL price found support at the 100 SMA ($144.82), which aligns with Fibonacci support levels. The recent bounce from that zone has pushed SOL back up to $159.88, with a daily gain of +2.28%.
Importantly, SOL price is now attempting to flip the 20-day SMA ($160.29) and 50-day SMA ($162.77) into support. This confluence creates a key battleground zone between $160–$163. A daily close above this range could attract a fresh wave of buyers. If that happens, the next target is the 200 SMA at $176.33.
Let’s do a quick calculation:
If Solana price maintains a $5 daily gain (as it did in the last 24 hours) and breaks $163 resistance by mid-week, then:
$159.88 + ($5 × 3 days) = $174.88 by Thursday, testing the 200 SMA and possibly triggering FOMO among swing traders.
What Are the Key Support and Resistance Levels to Watch?
- Immediate resistance sits at $160–$163, which includes short-term SMAs and recent price rejection zones. A successful breakout above this area opens up room toward $170 and then $176.
- Strong support lies near $144. If SOL price breaks below $152 (the 100-hour SMA zone), bears could regain control and push the price back to $140–$145. The long-term bullish thesis holds only if $140 remains intact as a base.
Solana Price Prediction: Will SOL Price Break $170 This Week?
There’s a decent probability. The hourly chart suggests a short-term bullish continuation, while the daily chart shows a larger pattern forming that could lead to a breakout if Solana price holds above the moving average cluster. The 20- and 50-day SMAs converging indicate that a “Golden Cross” setup could be near—a historically bullish signal.
Considering the momentum, Fibonacci targets, and moving average dynamics, a move toward $170–$175 is realistic by this weekend if BTC stays above $100K and broader crypto sentiment remains positive.
Final Thoughts
Solana price is not just recovering —it’s showing technical signs of strength across both short-term and mid-term timeframes. If buyers defend $155 and flip $160–$163 into support, we could be looking at a breakout week. Traders should closely monitor volume surges and 4-hour candle confirmations to ride this move.
If $160 holds, Solana price can rally to $171–$175 this week. However, a failure to maintain $153 could drag the SOL price back to $144. Risk is manageable, but momentum is clearly shifting toward the bulls.
$SOL, $Solana
Disclaimer: The content of this article solely reflects the author's opinion and does not represent the platform in any capacity. This article is not intended to serve as a reference for making investment decisions.
You may also like
Even gold and silver couldn't hold up: global stock markets and cryptocurrencies plunge, "all assets are falling"
Market sentiment reversed sharply, with global stock markets collectively declining on Tuesday. Gold, silver, and copper retreated, and cryptocurrencies experienced a widespread drop.

Denying "Trump insider" rumors, increasing short positions to $340 millions! The "whale" who accurately targeted the crypto market last week makes new moves
The mysterious trader "whale" acted swiftly and decisively. After depositing $40 million in principal on Monday, this address used 10x leverage to establish a bitcoin short position with a notional value of approximately $340 millions.

BNB price drops 12% from all-time highs: Is the bull run over?
From $10 to $10,000: How dollar-cost averaging works in crypto