

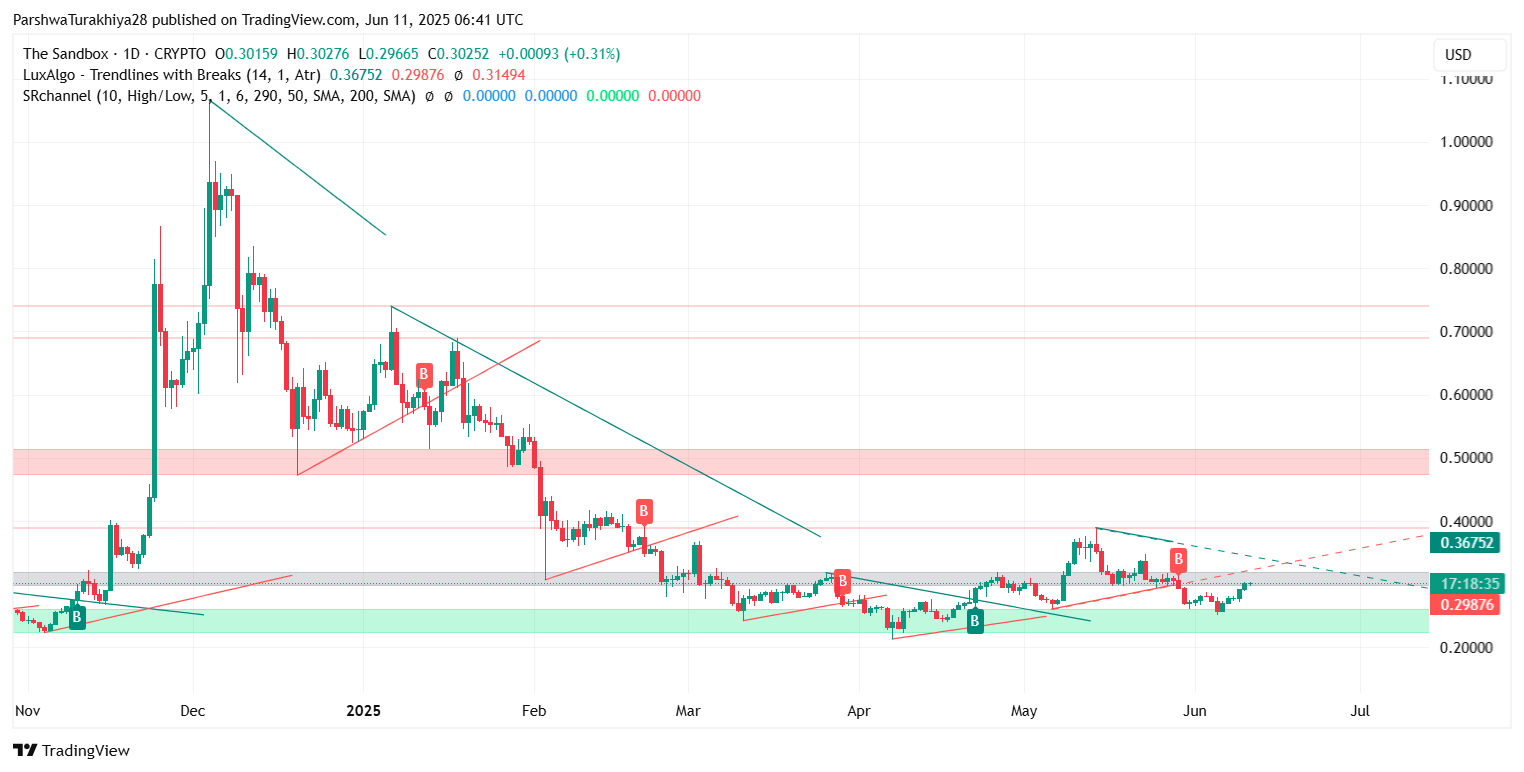
The Sandbox price today is trading around $0.302, reflecting a continuation of the recent bullish structure that began forming after SAND rebounded from the June low of $0.251. The recovery has been marked by higher lows, consistent breakouts through intraday resistance zones, and improving momentum across several timeframes. However, with the asset nearing a confluence of key technical ceilings, traders are watching for signs of either sustained upside or a short-term pullback.
What’s Happening With The Sandbox’s Price?
 SANDUSD price dynamics (Source: TradingView)
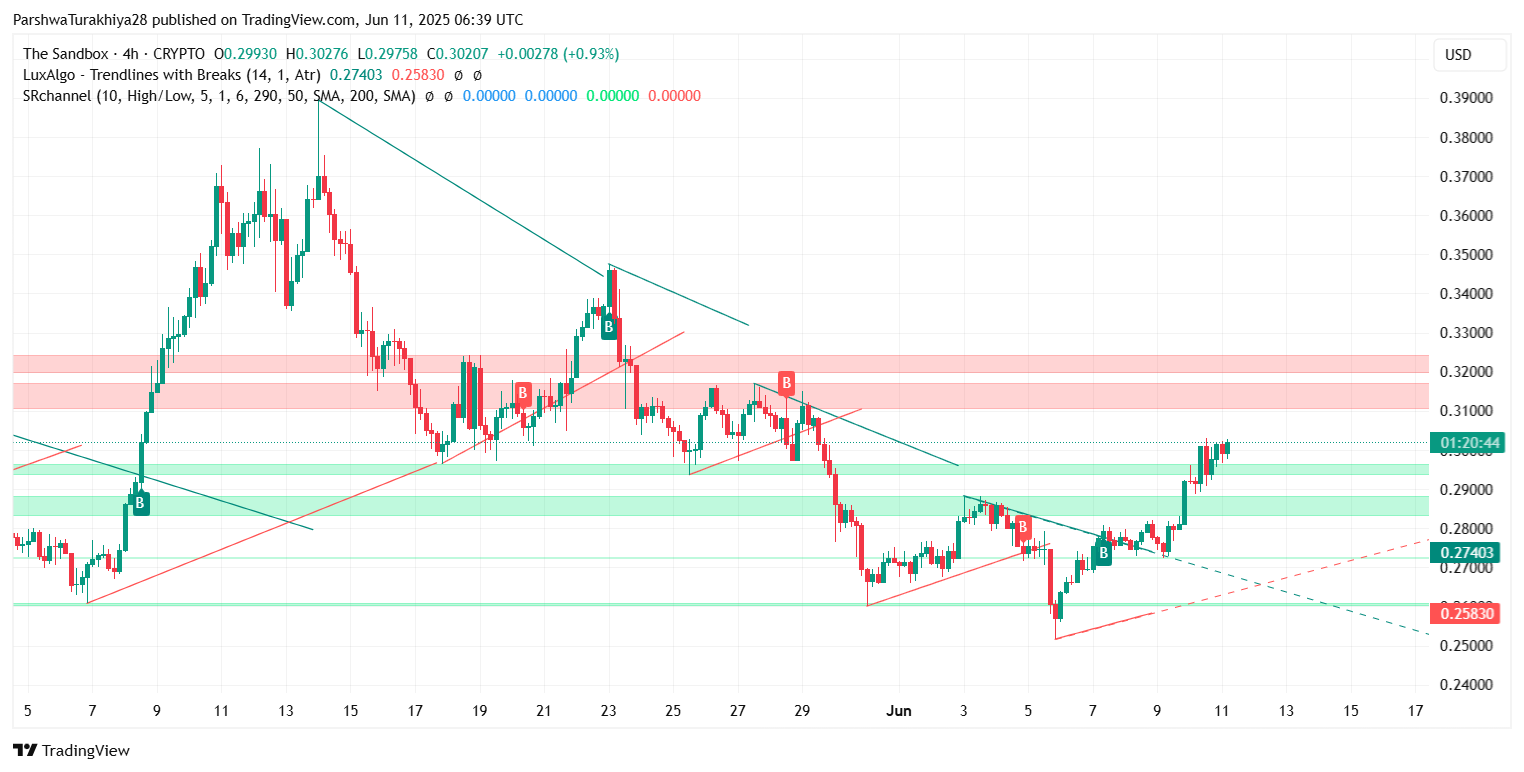
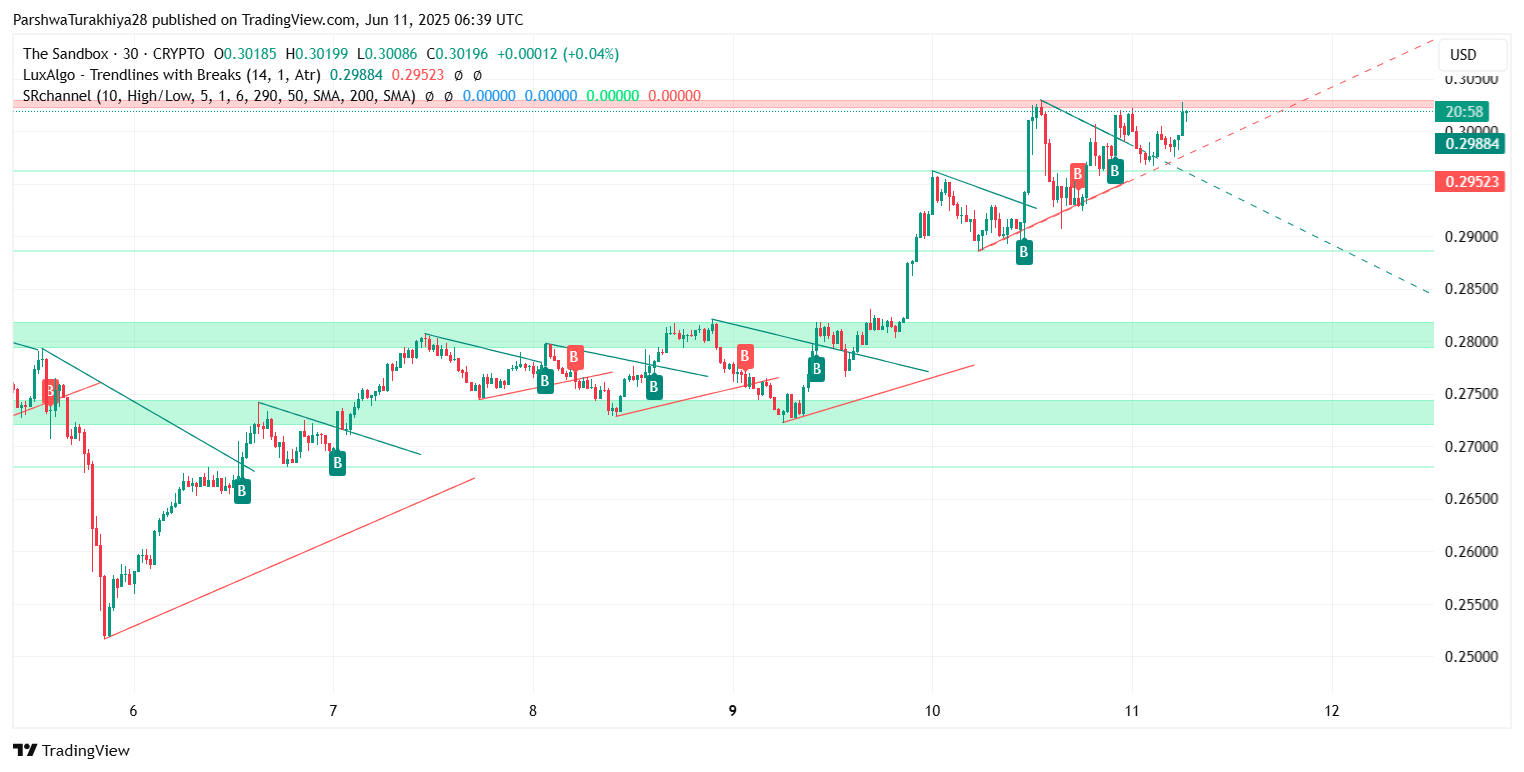
A multi-day bullish channel is now intact on the 30-minute and 4-hour charts. Price recently broke above the $0.298–$0.300 supply zone, which had previously rejected multiple rallies. The Sandbox price action shows a breakout from a descending wedge, with volume confirming bullish conviction. This breakout is now backed by a retest of the wedge’s former resistance, which is now acting as intraday support near $0.295.
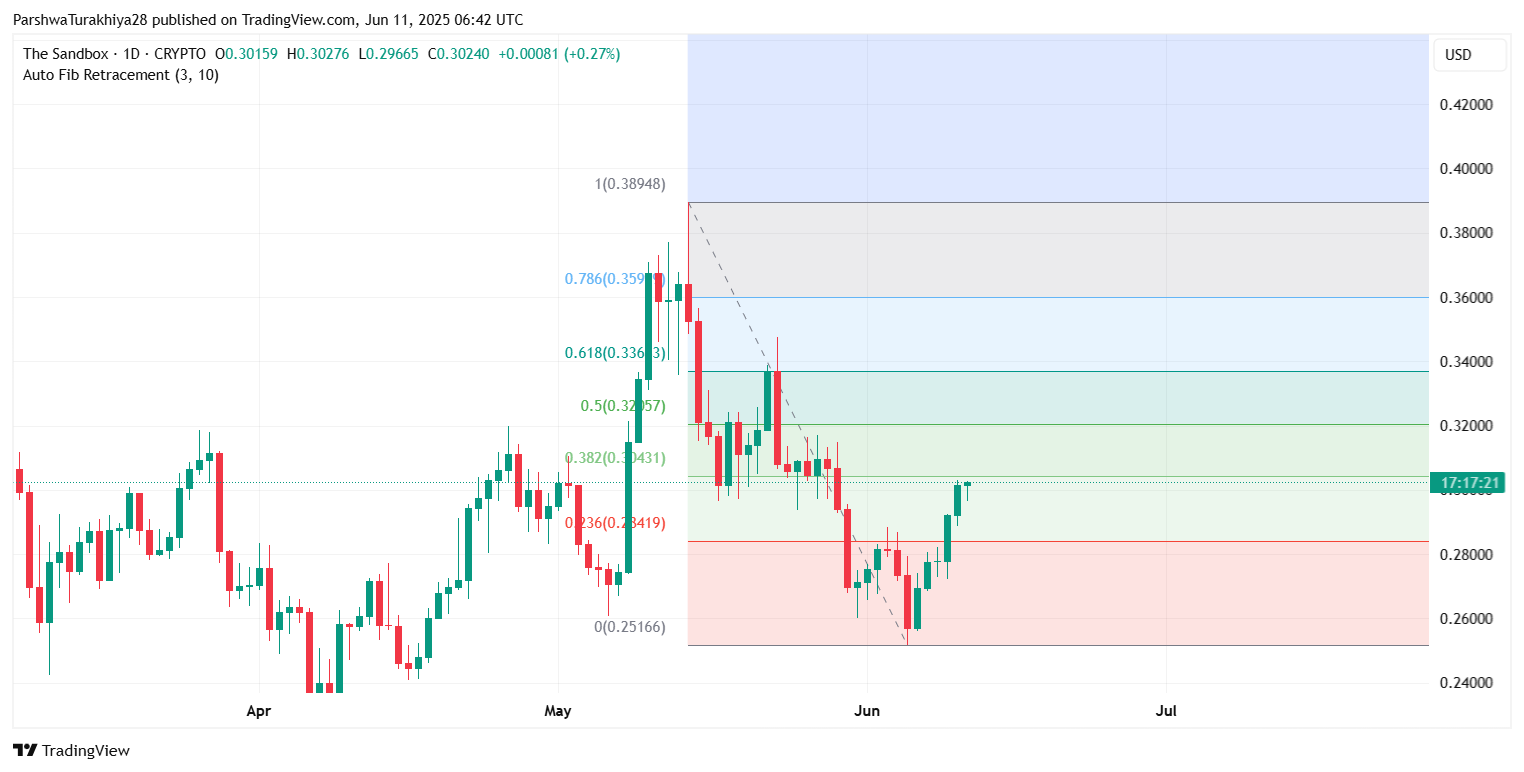
Moreover, on the daily chart, SAND is consolidating just below the Fibonacci 0.382 retracement level of $0.3043, measured from the April high near $0.389 to the recent low. A decisive move above this zone could open the door toward the 0.5 and 0.618 Fib levels at $0.326 and $0.336, respectively.
RSI, MACD, and Momentum Show Bulls in Control
 SANDUSD price dynamics (Source: TradingView)
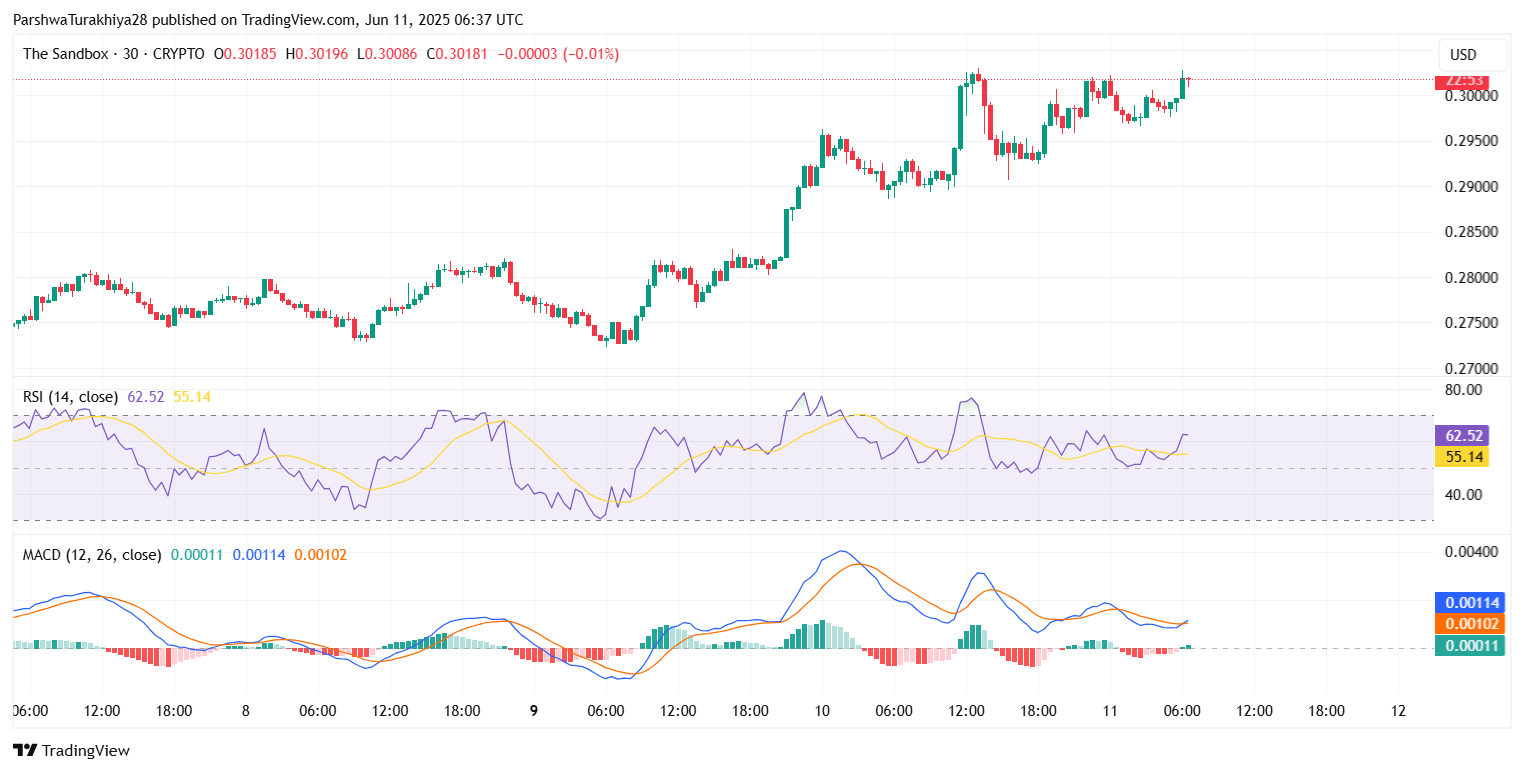
The RSI on the 30-minute chart is currently at 62.52, with a steady upward slope, signaling continued strength but not yet overbought. On the Stochastic RSI, the %K line has just crossed above the %D line and is entering the 80 zone, typically associated with short-term bullish pressure. If momentum sustains, this could fuel further The Sandbox price spikes above the recent range.
Meanwhile, the MACD has flipped into bullish territory, with both signal lines above zero and the histogram printing green bars. This aligns with increasing upward volume and suggests that the trend is not yet exhausted.
Ichimoku Cloud and Bollinger Bands Support the Uptrend
 SANDUSD price dynamics (Source: TradingView)
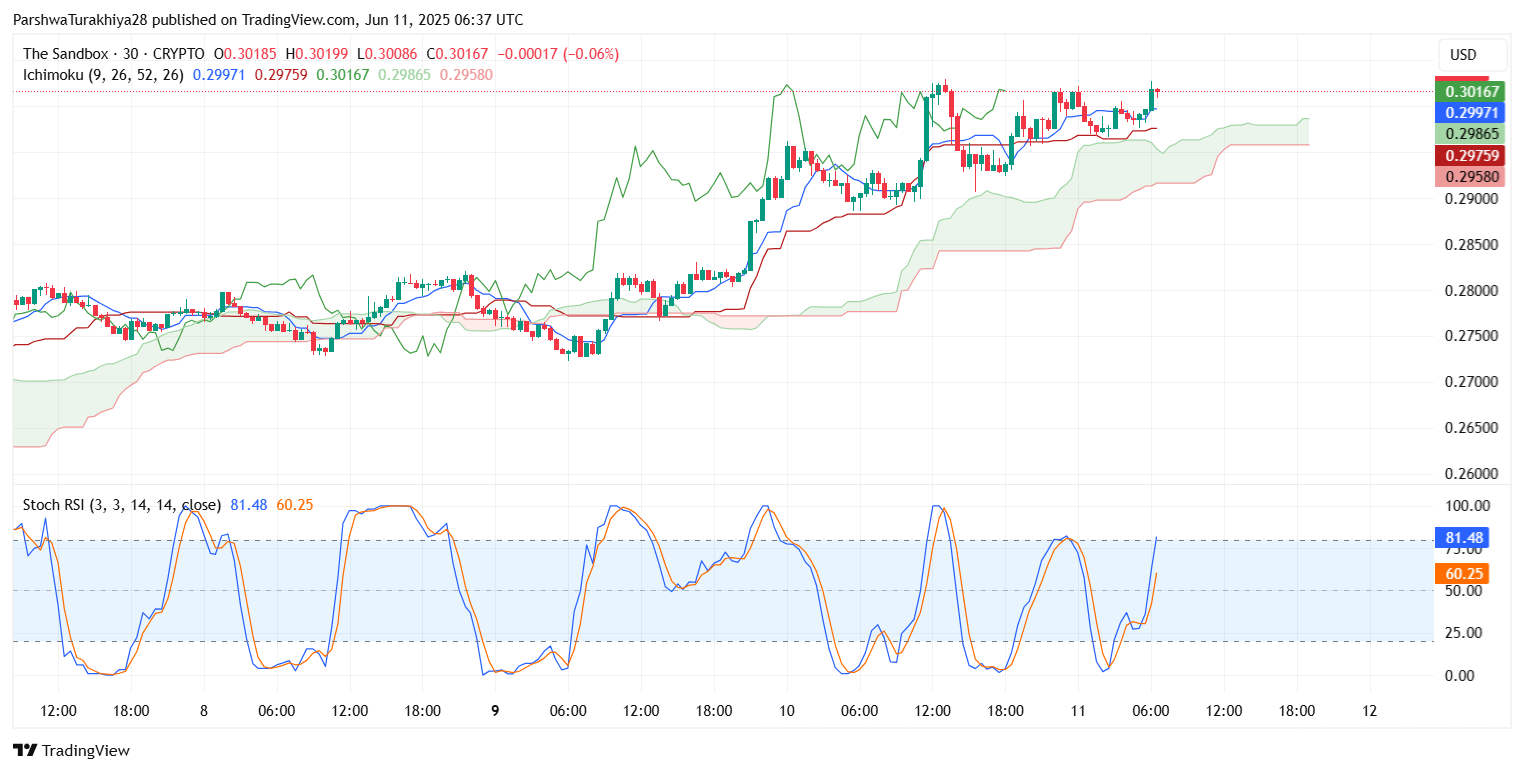
From an Ichimoku perspective, the price is comfortably above the cloud on both the 30-minute and 4-hour charts. The Tenkan-sen and Kijun-sen have completed a bullish crossover, and the Leading Span A is angled upward. This indicates a structurally bullish outlook. Unless price breaks below the cloud at $0.298, the cloud base will likely act as near-term support.
 SANDUSD price dynamics (Source: TradingView)
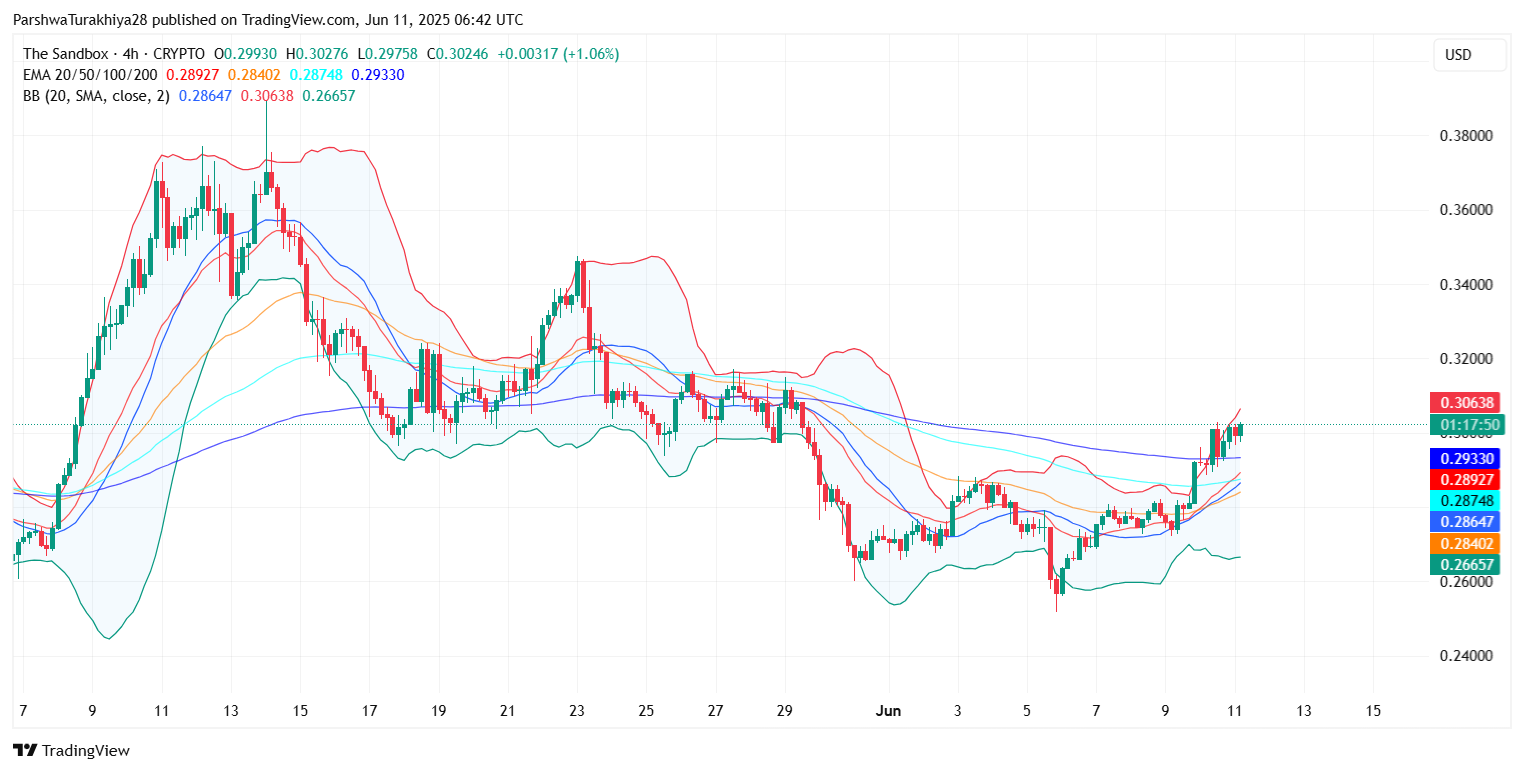
On the Bollinger Bands (4H), The Sandbox price today is hugging the upper band, suggesting that the market is in a volatility expansion phase. While this can sometimes hint at a short-term overextension, the absence of bearish divergence on the RSI indicates that the move still has room to run before a retracement becomes probable.
Higher Timeframe Confluence Suggests a Mid-Term Target at $0.336
 SANDUSD price dynamics (Source: TradingView)
Zooming out to the daily chart, the structure is forming a gradual ascending triangle with horizontal resistance at $0.304 and dynamic support rising from the $0.27 region. The 20, 50, and 100 EMA cluster between $0.284 and $0.293 has now flipped into support, and the 200 EMA around $0.306 is being tested.
 SANDUSD price dynamics (Source: TradingView)
The weekly chart shows that The Sandbox price has reclaimed the 0.236 Fibonacci level at $0.341, and is aiming for the 0.382 level at $0.3431 next. This move is part of a broader reversal structure forming after months of lower highs. If bulls maintain control, a medium-term rise toward $0.36–$0.38 is possible over the next few weeks.
Why Is The Sandbox Price Going Up Today?
 SANDUSD price dynamics (Source: TradingView)
The breakout above key resistance levels, improved technical structure across lower and higher timeframes, and bullish momentum indicators collectively explain why The Sandbox price going up today. A series of higher lows and strong reactions off the $0.27 and $0.295 zones confirm that accumulation is underway. Additionally, sentiment across the metaverse token sector has slightly improved, lending further strength to speculative plays like SAND.
Short-term traders are likely targeting $0.305–$0.310 as the next resistance band, followed by $0.326. On the downside, immediate support lies at $0.295, with stronger demand around $0.284 should a pullback occur.
Short-Term Forecast Table
| Timeframe | Bias | Key Support | Key Resistance | Indicators Confirming |
| Intraday | Bullish | $0.295 / $0.284 | $0.304 / $0.310 | RSI rising, MACD bullish, Ichimoku support |
| Short-Term | Bullish | $0.284 | $0.326 / $0.336 | Bollinger upper band, Fib levels, EMA cluster |
| Medium-Term | Cautious Bullish | $0.27 | $0.343 / $0.36 | Triangle breakout, Fib 0.5–0.618 zone |
Disclaimer: The information presented in this article is for informational and educational purposes only. The article does not constitute financial advice or advice of any kind. Coin Edition is not responsible for any losses incurred as a result of the utilization of content, products, or services mentioned. Readers are advised to exercise caution before taking any action related to the company.