Bitget App
Trade smarter
Buy cryptoMarketsTradeFuturesEarnWeb3SquareMore
Trade
Spot
Buy and sell crypto with ease
Margin
Amplify your capital and maximize fund efficiency
Onchain
Going Onchain, without going Onchain!
Convert & block trade
Convert crypto with one click and zero fees
Explore
Launchhub
Gain the edge early and start winning
Copy
Copy elite trader with one click
Bots
Simple, fast, and reliable AI trading bot
Trade
USDT-M Futures
Futures settled in USDT
USDC-M Futures
Futures settled in USDC
Coin-M Futures
Futures settled in cryptocurrencies
Explore
Futures guide
A beginner-to-advanced journey in futures trading
Futures promotions
Generous rewards await
Overview
A variety of products to grow your assets
Simple Earn
Deposit and withdraw anytime to earn flexible returns with zero risk
On-chain Earn
Earn profits daily without risking principal
Structured Earn
Robust financial innovation to navigate market swings
VIP and Wealth Management
Premium services for smart wealth management
Loans
Flexible borrowing with high fund security
See How Liquidation Waves Hit SUI Coin Hard!

See How Liquidation Waves Hit SUI Coin Hard!

CointurkCointurk2025/06/11 15:40
By:İlayda Peker

In Brief SUI coin drops 7.07% over the past month, trading at $3.72. Liquidation cluster identified, affecting long positions between $3.90 and $3.95. Key support and resistance levels: $3.73-3.85 and $4.02, respectively.

SUI coin has experienced a 7.07% decline over the past month, trading at $3.72. This downturn followed a substantial 67.90% increase in the previous month, leaving investors disappointed. Despite strong developments like the launch of the Axelar Bridge, Phantom Wallet integration, Binance Alpha support, an increase in Total Locked Value (TVL), and the “Great Sui Odyssey” event on May 17th, the crucial question arises: is this a retracement or a pause before reaching a new zenith?

SUI Coin Faces a Liquidation Wave

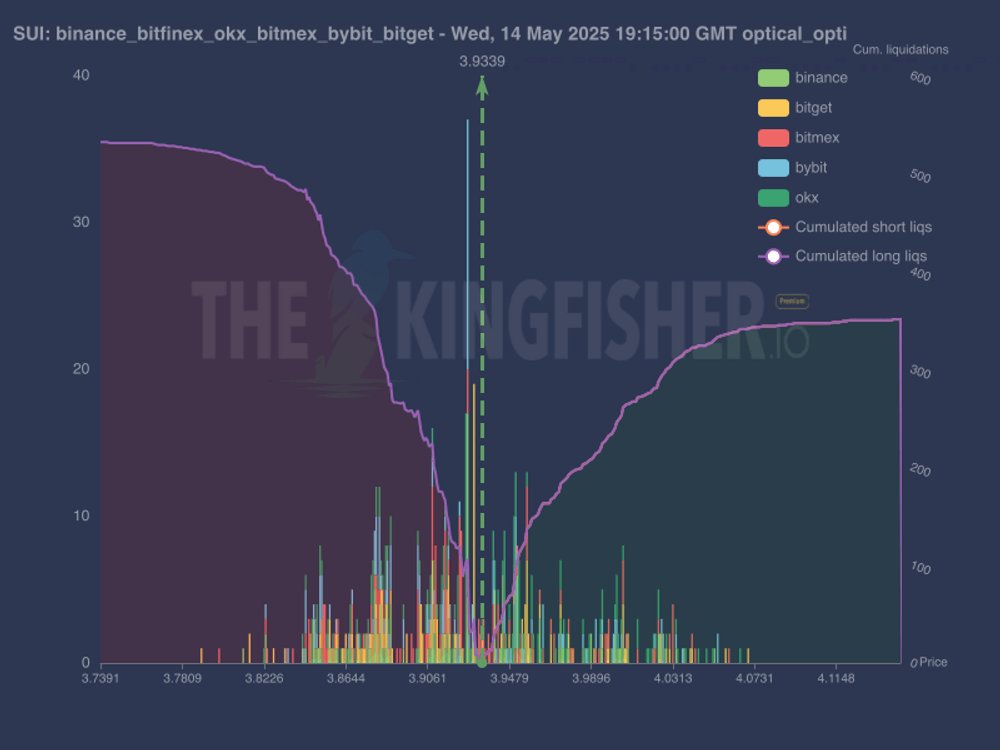
The Kingfisher’s analysis of the SUI coin’s liquidation heat map reveals a cluster of long position liquidations concentrated between $3.90 and $3.95, particularly around $3.933. The analyst noted that as the altcoin ‘s price fell below this level, leveraged long positions were liquidated, increasing the selling pressure.

See How Liquidation Waves Hit SUI Coin Hard! image 0 Altcoin SUI Heat Map

This liquidation area acted like a black hole, pulling down the price and intensifying the decline. Moreover, the heat map indicates fewer short position liquidations above the current price, warning of limited momentum for a short squeeze capable of pushing the price upwards in the short term. In other words, there is little ammunition for sudden upward movements.

SUI Coin Price Analysis and Key Levels

Currently, the price of SUI coin hovers slightly above the critical support zone set between $3.73 and $3.85. If SUI decisively drops below and closes lower in this range, a steeper decline could be triggered, particularly as the pressure from liquidation on long positions persists. The trading volume also acts as an indicator contributing to the downturn. According to CoinMarketCap, trading volume has decreased by 24.09% over the last 24 hours. Such a drop in volume is often interpreted as a precursor to increased volatility.

For upward movement, the first significant resistance emerges at the $4.02 level. To signal more robust optimism, the price needs to close daily above the $4.35 level. Such a closure could confirm the continuation of the uptrend and set SUI on a path to form a new peak above its current all-time high of $5.35.

Given the current market conditions, short-term investors are advised to assess risks carefully and closely monitor liquidation levels and support zones.

0

Disclaimer: The content of this article solely reflects the author's opinion and does not represent the platform in any capacity. This article is not intended to serve as a reference for making investment decisions.

PoolX: Earn new token airdrops
Lock your assets and earn 10%+ APR
Lock now!

You may also like

New spot margin trading pair — HOLO/USDT!

Bitget Announcement2025/09/12 07:46

FUN drops by 32.34% within 24 hours as it faces a steep short-term downturn

- FUN plunged 32.34% in 24 hours to $0.008938, marking a 541.8% monthly loss amid prolonged bearish trends. - Technical breakdowns, elevated selling pressure, and forced liquidations highlight deteriorating market sentiment and risk-off behavior. - Analysts identify key support below $0.0080 as critical, with bearish momentum confirmed by RSI (<30) and MACD indicators. - A trend-following backtest strategy proposes short positions based on technical signals to capitalize on extended downward trajectories.

Bitget-RWA2025/09/12 06:14
FUN drops by 32.34% within 24 hours as it faces a steep short-term downturn

OPEN has dropped by 189.51% within 24 hours during a significant market pullback

- OPEN's price plummeted 189.51% in 24 hours to $0.8907, marking its largest intraday decline in history. - The token fell 3793.63% over 7 days, matching identical monthly and yearly declines, signaling severe bearish momentum. - Technical analysts cite broken support levels and lack of bullish catalysts as key drivers of the sustained sell-off. - Absence of stabilizing volume or reversal patterns leaves the market vulnerable to further downward pressure.

Bitget-RWA2025/09/12 06:14
OPEN has dropped by 189.51% within 24 hours during a significant market pullback

New spot margin trading pair — LINEA/USDT!

Bitget Announcement2025/09/11 10:04