
- KAIA rallied 38% with volume surging 1,750%, confirming real market interest.
- Hidden bullish RSI divergence, MACD crossover, and EMA compression signal a confirmed trend reversal.
- A break above $0.158 clears the path to $0.216, with Golden Cross confirmation likely in the coming sessions.
Kaia (KAIA) has delivered an explosive performance this week, surging over 38% and marking a local high of $0.1286. The move was underpinned by a parabolic increase in trading volume, which spiked more than 1,750% in just 24 hours, reaching $122 million. This surge triggered roughly $901K in short liquidations, intensifying upward pressure and creating a window for bullish continuation.
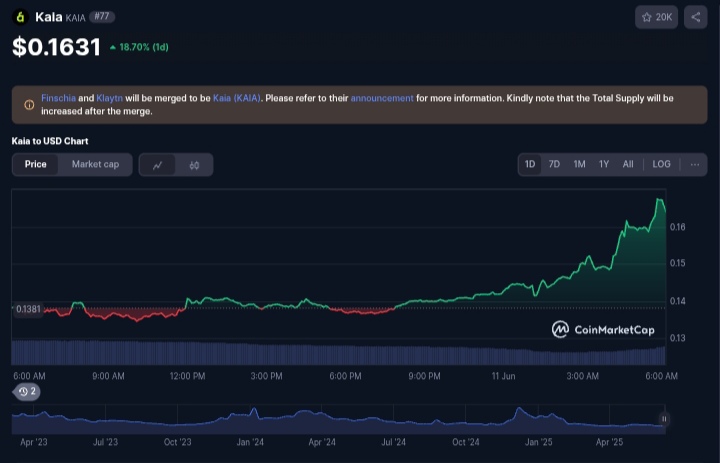 Source: CoinMarketCap
From a structural standpoint, KAIA token is now approaching the critical $0.158 level, which coincides with the 200-day exponential moving average (EMA)—a long-watched technical barrier that often marks trend shifts in crypto assets. The price also broke above key local resistance levels at $0.1148 and $0.1207, signaling buyers are firmly in control.
Momentum Indicators Confirm Technical Reversal
Technically, the indicators confirm this rally is more than just speculative froth. The Relative Strength Index (RSI) is currently at 85 which indicates an overbought level and peak buying activities, this could lead to a temporal price adjustments before a bullish trend takes off. This pattern often precedes a full-blown trend reversal.
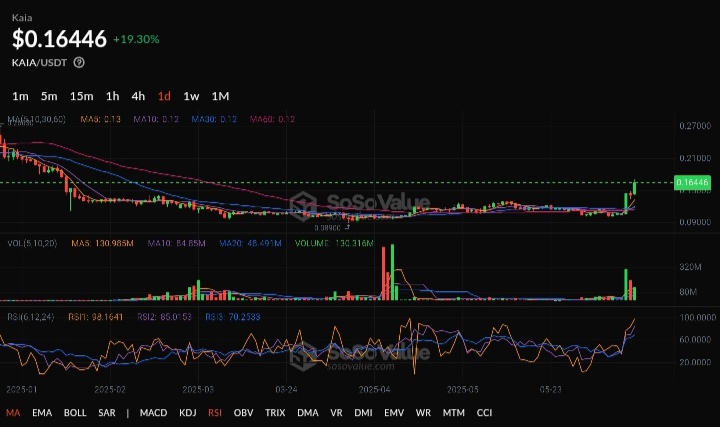 Source: SoSoValue
The MACD has also turned in favor of bulls, with its histogram flipping positive and a bullish crossover forming below the zero line. This type of crossover in negative territory typically marks a base-forming transition. If the MACD continues higher and crosses the zero line in coming sessions, it would confirm a medium-term momentum shift. Similarly, the Stochastic RSI has crossed above the 80 threshold, reinforcing the return of upward momentum—though some cooling could follow.
Support and Resistance Levels to Watch
Kaia Price is currently trading within the $0.145 to $0.158 consolidation zone, and a decisive close above $0.158 would open the door for a rally toward $0.216, the 38.2% Fibonacci retracement level drawn from the broader correction between $0.34 and $0.109. This target also aligns with the next significant structural resistance area. Should bulls maintain control, higher retracement targets at $0.27 (50%) and even $0.31 (61.8%) could come into play—though the latter likely requires broader macro support.
Support remains strong near $0.135, recently reclaimed as a key horizontal base, and $0.130, where the 50-day EMA currently sits. This EMA has now been crossed by the 20-day EMA, forming a bullish stack with both curves converging toward the 100-day EMA around $0.142.
A pending Golden Cross setup is now in focus: if the 50-day EMA (~$0.132) overtakes the 200-day EMA (~$0.158) in the coming sessions, it would validate a bullish medium-term shift and may invite institutional momentum traders.
This bullish alignment of the EMAs strengthens the base structure, especially as price continues to hug the 200-day EMA. A successful breakout above this level could ignite a larger wave of technical buying.
Market Data Confirms Bullish Sentiment
Market internals support the case for continuation. Volume has tripled compared to the 30-day average, confirming that this move is underpinned by real accumulation rather than low-liquidity speculation. Open interest has climbed 22% week-over-week, reflecting capital inflows without excessive long crowding.
Additionally, the Average True Range (ATR) has dropped to a 45-day low, suggesting tight price compression—a common precursor to breakout volatility. This confluence of quieting volatility, strong momentum indicators, and growing market participation sets the stage for a potential expansion phase.
KAIA is no longer just bouncing—it’s forming a well-supported bullish structure backed by volume, trend alignment, and indicator convergence. If bulls can clear the $0.158–$0.168 resistance range, the rally could accelerate toward $0.216, with $0.27 as a mid-term target.
Highlighted Crypto News for Today
After an 18% Pump, Can Uniswap (UNI) Flip Resistance Into Moon Mode?