Bitget App
Trade smarter
Buy cryptoMarketsTradeFuturesEarnWeb3SquareMore
Trade
Spot
Buy and sell crypto with ease
Margin
Amplify your capital and maximize fund efficiency
Onchain
Going Onchain, without going Onchain!
Convert & block trade
Convert crypto with one click and zero fees
Explore
Launchhub
Gain the edge early and start winning
Copy
Copy elite trader with one click
Bots
Simple, fast, and reliable AI trading bot
Trade
USDT-M Futures
Futures settled in USDT
USDC-M Futures
Futures settled in USDC
Coin-M Futures
Futures settled in cryptocurrencies
Explore
Futures guide
A beginner-to-advanced journey in futures trading
Futures promotions
Generous rewards await
Overview
A variety of products to grow your assets
Simple Earn
Deposit and withdraw anytime to earn flexible returns with zero risk
On-chain Earn
Earn profits daily without risking principal
Structured Earn
Robust financial innovation to navigate market swings
VIP and Wealth Management
Premium services for smart wealth management
Loans
Flexible borrowing with high fund security
Solana (SOL) To Soar Higher? Key Pattern Suggests Potential Upside Move

Solana (SOL) To Soar Higher? Key Pattern Suggests Potential Upside Move

CoinsProbeCoinsProbe2025/06/12 16:56
By:Nilesh Hembade

Date: Wed, June 11, 2025 | 08:04 AM GMT

The cryptocurrency market has staged an impressive rebound this quarter, with Ethereum (ETH) leading the charge. After climbing over 53% in Q2, ETH is now trading near $2,800, having recently touched a high not seen since February. The momentum is sparking interest across the major altcoins including Solana (SOL).

SOL is currently up by over 5% today and showing strong signs of a bullish continuation. More importantly, its chart is flashing a potentially powerful “Power of 3” pattern, hinting at a major move on the horizon.

Solana (SOL) To Soar Higher? Key Pattern Suggests Potential Upside Move image 0 Source: Coinmarketcap

Power of 3 Pattern in Play

On the 4-hour chart, SOL appears to be following the widely recognized Power of 3 market structure — a concept often associated with smart money trading strategies. This structure is divided into three phases:

Accumulation Phase: Between May 9 and May 30, SOL consolidated within a narrow sideways range between $159 and $184. This low-volatility zone is typically where institutional players accumulate positions, often before initiating a bigger move.

Manipulation Phase: On May 30, SOL suddenly broke below the accumulation zone, dropping to a low of around $141. This sharp move likely triggered retail stop-losses and created short-term panic — a textbook manipulation phase that shakes out weaker hands.

Solana (SOL) To Soar Higher? Key Pattern Suggests Potential Upside Move image 1 
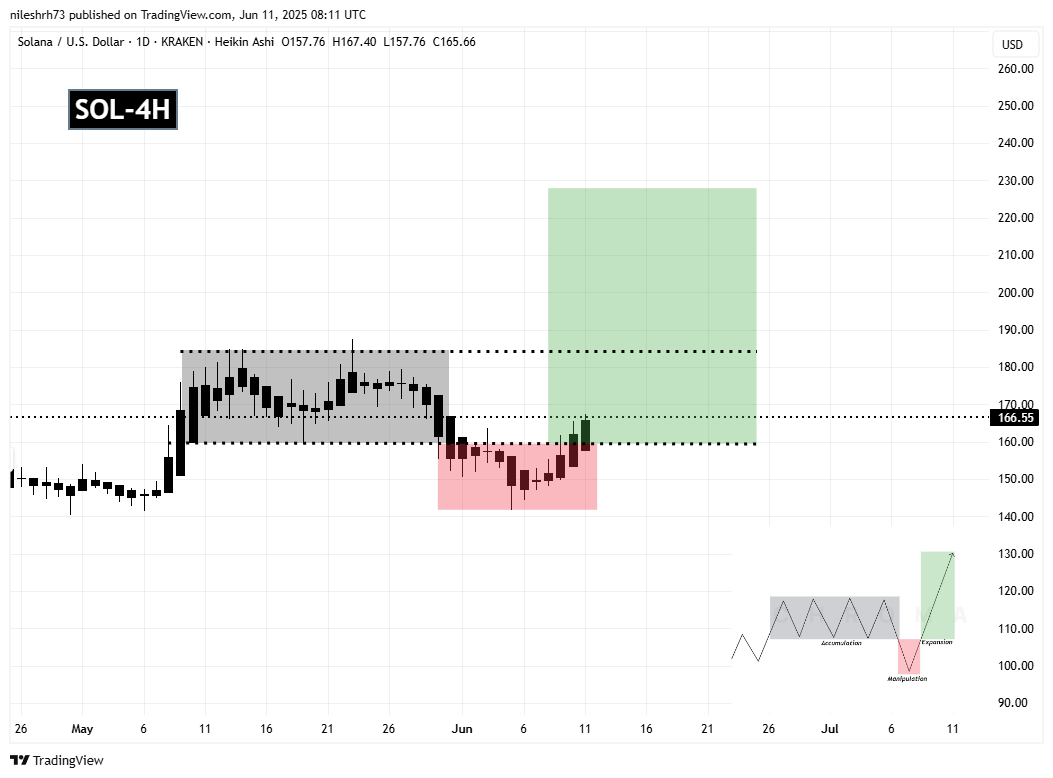
Solana (SOL) 4H Chart/Coinsprobe (Source: Tradingview)

Expansion Phase: However, shortly after that drop, SOL bounced back sharply and reclaimed the $159 level. The bounce marked the start of the Expansion Phase, where price aggressively moves in the true direction of the underlying trend. SOL is now revisiting the $184 resistance, which was once the top of the accumulation zone.

What’s Next for SOL?

If SOL flips the $184 resistance into support, it would confirm a clean breakout from the Power of 3 structure. This could spark a strong continuation rally.

According to technical projections derived from this setup, the next major target lies at $227, which represents a potential 36% upside from the breakout point. This level could act as a magnet for price action if bullish momentum continues and Bitcoin remains stable.

Disclaimer: This article is for informational purposes only and not financial advice. Always conduct your own research before investing in cryptocurrencies.

0

Disclaimer: The content of this article solely reflects the author's opinion and does not represent the platform in any capacity. This article is not intended to serve as a reference for making investment decisions.

PoolX: Earn new token airdrops
Lock your assets and earn 10%+ APR
Lock now!

You may also like

FUN drops by 32.34% within 24 hours as it faces a steep short-term downturn

- FUN plunged 32.34% in 24 hours to $0.008938, marking a 541.8% monthly loss amid prolonged bearish trends. - Technical breakdowns, elevated selling pressure, and forced liquidations highlight deteriorating market sentiment and risk-off behavior. - Analysts identify key support below $0.0080 as critical, with bearish momentum confirmed by RSI (<30) and MACD indicators. - A trend-following backtest strategy proposes short positions based on technical signals to capitalize on extended downward trajectories.

Bitget-RWA2025/09/12 06:14
FUN drops by 32.34% within 24 hours as it faces a steep short-term downturn

OPEN has dropped by 189.51% within 24 hours during a significant market pullback

- OPEN's price plummeted 189.51% in 24 hours to $0.8907, marking its largest intraday decline in history. - The token fell 3793.63% over 7 days, matching identical monthly and yearly declines, signaling severe bearish momentum. - Technical analysts cite broken support levels and lack of bullish catalysts as key drivers of the sustained sell-off. - Absence of stabilizing volume or reversal patterns leaves the market vulnerable to further downward pressure.

Bitget-RWA2025/09/12 06:14
OPEN has dropped by 189.51% within 24 hours during a significant market pullback

New spot margin trading pair — LINEA/USDT!

Bitget Announcement2025/09/11 10:04