Bitget App
Trade smarter
Buy cryptoMarketsTradeFuturesEarnWeb3SquareMore
Trade
Spot
Buy and sell crypto with ease
Margin
Amplify your capital and maximize fund efficiency
Onchain
Going Onchain, without going Onchain!
Convert & block trade
Convert crypto with one click and zero fees
Explore
Launchhub
Gain the edge early and start winning
Copy
Copy elite trader with one click
Bots
Simple, fast, and reliable AI trading bot
Trade
USDT-M Futures
Futures settled in USDT
USDC-M Futures
Futures settled in USDC
Coin-M Futures
Futures settled in cryptocurrencies
Explore
Futures guide
A beginner-to-advanced journey in futures trading
Futures promotions
Generous rewards await
Overview
A variety of products to grow your assets
Simple Earn
Deposit and withdraw anytime to earn flexible returns with zero risk
On-chain Earn
Earn profits daily without risking principal
Structured Earn
Robust financial innovation to navigate market swings
VIP and Wealth Management
Premium services for smart wealth management
Loans
Flexible borrowing with high fund security
Sui (SUI) Making Pullback After Key Pattern Completion – Will It Bounce Back?

Sui (SUI) Making Pullback After Key Pattern Completion – Will It Bounce Back?

CoinsProbeCoinsProbe2025/06/12 16:56
By:Nilesh Hembade

Date: Thu, June 12, 2025 | 01:10 PM GM

The cryptocurrency market is undergoing a mild correction after yesterday’s rally sparked by the release of softer-than-expected U.S. CPI data. Ethereum (ETH), which had surged to a 24-hour high of $2,877, has slipped back to around $2,733, and this broader cooling off is putting pressure on several major altcoins — including Sui (SUI).

At the time of writing, SUI is trading lower by over 5%, sliding from its daily peak of $3.51 to around $3.27. However, the latest price action isn’t just a random drop — a deeper look at the chart reveals that SUI might be in the midst of a textbook harmonic retracement.

Sui (SUI) Making Pullback After Key Pattern Completion – Will It Bounce Back? image 0 
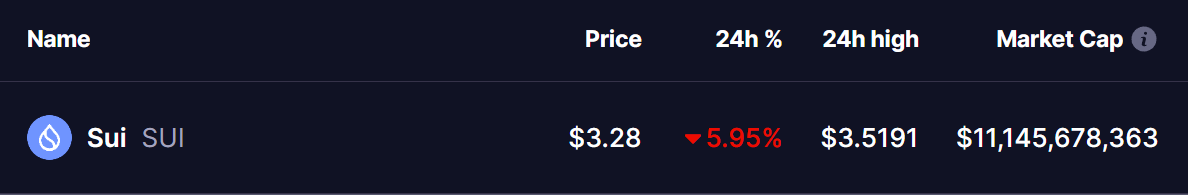
Source: Coinmarketcap

Bearish Cypher Pattern Unfolding

SUI’s 4-hour chart has completed a Bearish Cypher harmonic pattern, which typically signals the start of a temporary downtrend or pullback. The D-point of the pattern was finalized near the $3.55 mark — lining up closely with the 0.786 Fibonacci retracement of the X to C leg, a zone widely recognized as a Potential Reversal Zone (PRZ) for this pattern.

Sui (SUI) Making Pullback After Key Pattern Completion – Will It Bounce Back? image 1 
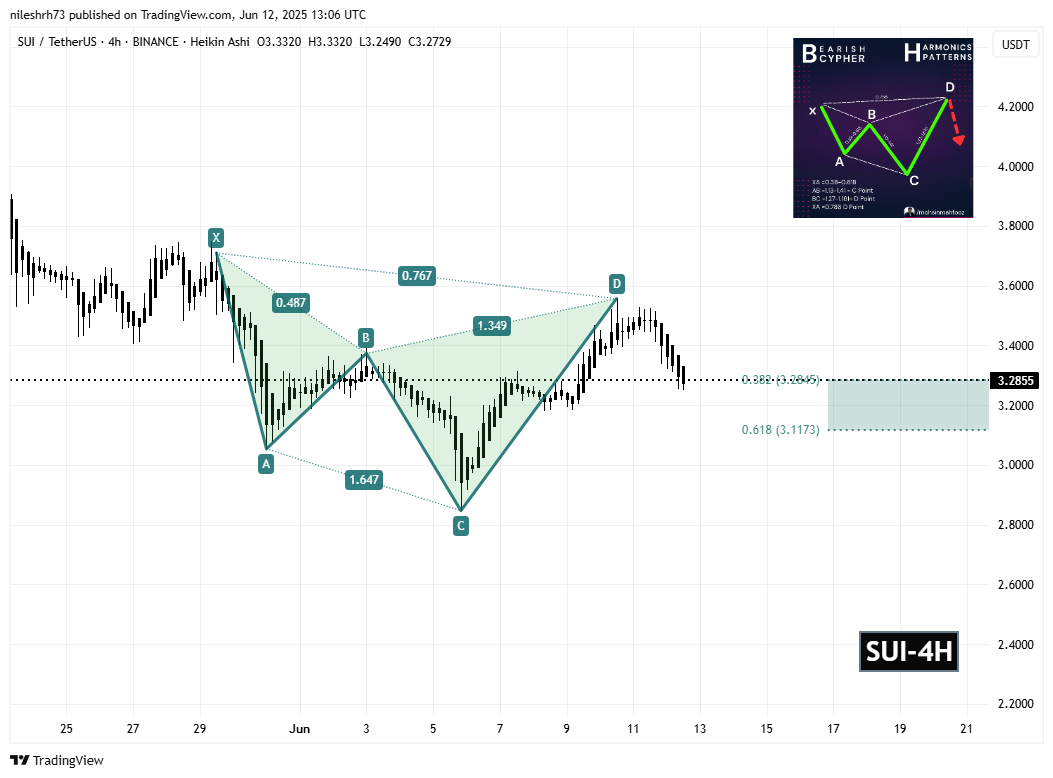
Sui (SUI) 4H Chart/Coinsprobe (Source: Tradingview)

As expected, once price hit that resistance area, it reversed sharply, slipping back toward the first support at $3.28 — which aligns with the 0.382 Fibonacci retracement from the recent swing. The reaction at this level so far confirms active selling pressure and a technically guided correction phase.

What’s Next for SUI?

With the $3.28 level already tested, this 0.382 Fibonacci retracement zone could act as a key support and potentially trigger a bounce. However, if SUI fails to hold above this level, the price may decline further toward the 0.618 Fibonacci retracement level at $3.11 — the next critical support zone to watch.

If SUI manages to stabilize at 0.382 or 0.618 fib levels, it could regain bullish momentum and attempt a rebound back toward the $3.55 area, where minor resistance was previously established. Such a move would indicate a healthy continuation following the harmonic pullback.

Disclaimer: This article is for informational purposes only and does not constitute financial advice. Always conduct your own research and risk assessment before investing in cryptocurrencies.

0

Disclaimer: The content of this article solely reflects the author's opinion and does not represent the platform in any capacity. This article is not intended to serve as a reference for making investment decisions.

PoolX: Earn new token airdrops
Lock your assets and earn 10%+ APR
Lock now!

You may also like

New spot margin trading pair — HOLO/USDT!

Bitget Announcement2025/09/12 07:46

FUN drops by 32.34% within 24 hours as it faces a steep short-term downturn

- FUN plunged 32.34% in 24 hours to $0.008938, marking a 541.8% monthly loss amid prolonged bearish trends. - Technical breakdowns, elevated selling pressure, and forced liquidations highlight deteriorating market sentiment and risk-off behavior. - Analysts identify key support below $0.0080 as critical, with bearish momentum confirmed by RSI (<30) and MACD indicators. - A trend-following backtest strategy proposes short positions based on technical signals to capitalize on extended downward trajectories.

Bitget-RWA2025/09/12 06:14
FUN drops by 32.34% within 24 hours as it faces a steep short-term downturn

OPEN has dropped by 189.51% within 24 hours during a significant market pullback

- OPEN's price plummeted 189.51% in 24 hours to $0.8907, marking its largest intraday decline in history. - The token fell 3793.63% over 7 days, matching identical monthly and yearly declines, signaling severe bearish momentum. - Technical analysts cite broken support levels and lack of bullish catalysts as key drivers of the sustained sell-off. - Absence of stabilizing volume or reversal patterns leaves the market vulnerable to further downward pressure.

Bitget-RWA2025/09/12 06:14
OPEN has dropped by 189.51% within 24 hours during a significant market pullback

New spot margin trading pair — LINEA/USDT!

Bitget Announcement2025/09/11 10:04