Ethereum Price Faces Risk as Whale Activity Continues to Decline

Ethereum is flashing mixed signals as bullish momentum builds on the BBTrend, but falling whale activity and key technical zones add uncertainty.
Ethereum (ETH) is showing mixed signals as it hovers near a critical technical zone, with traders closely watching for a breakout or breakdown. On one hand, the BBTrend has flipped sharply bullish, jumping to 4.99 after hitting -3 just a day earlier—suggesting growing upside momentum.
On the other hand, whale activity continues to decline for the seventh consecutive day, a potential sign of weakening institutional confidence. With ETH stuck between strong resistance at $2,900 and key support at $2,679, the next move could define the short-term market direction.
Ethereum BBTrend Flips Bullish: What 4.99 Means for Price Action
Ethereum’s BBTrend has surged to 4.99, rising sharply in the past few hours after hitting a negative peak of -3 just yesterday.
This sudden momentum shift suggests a potential reversal from bearish to bullish conditions, as the trend strength has turned positive and is now approaching the upper threshold that typically signals a breakout scenario.
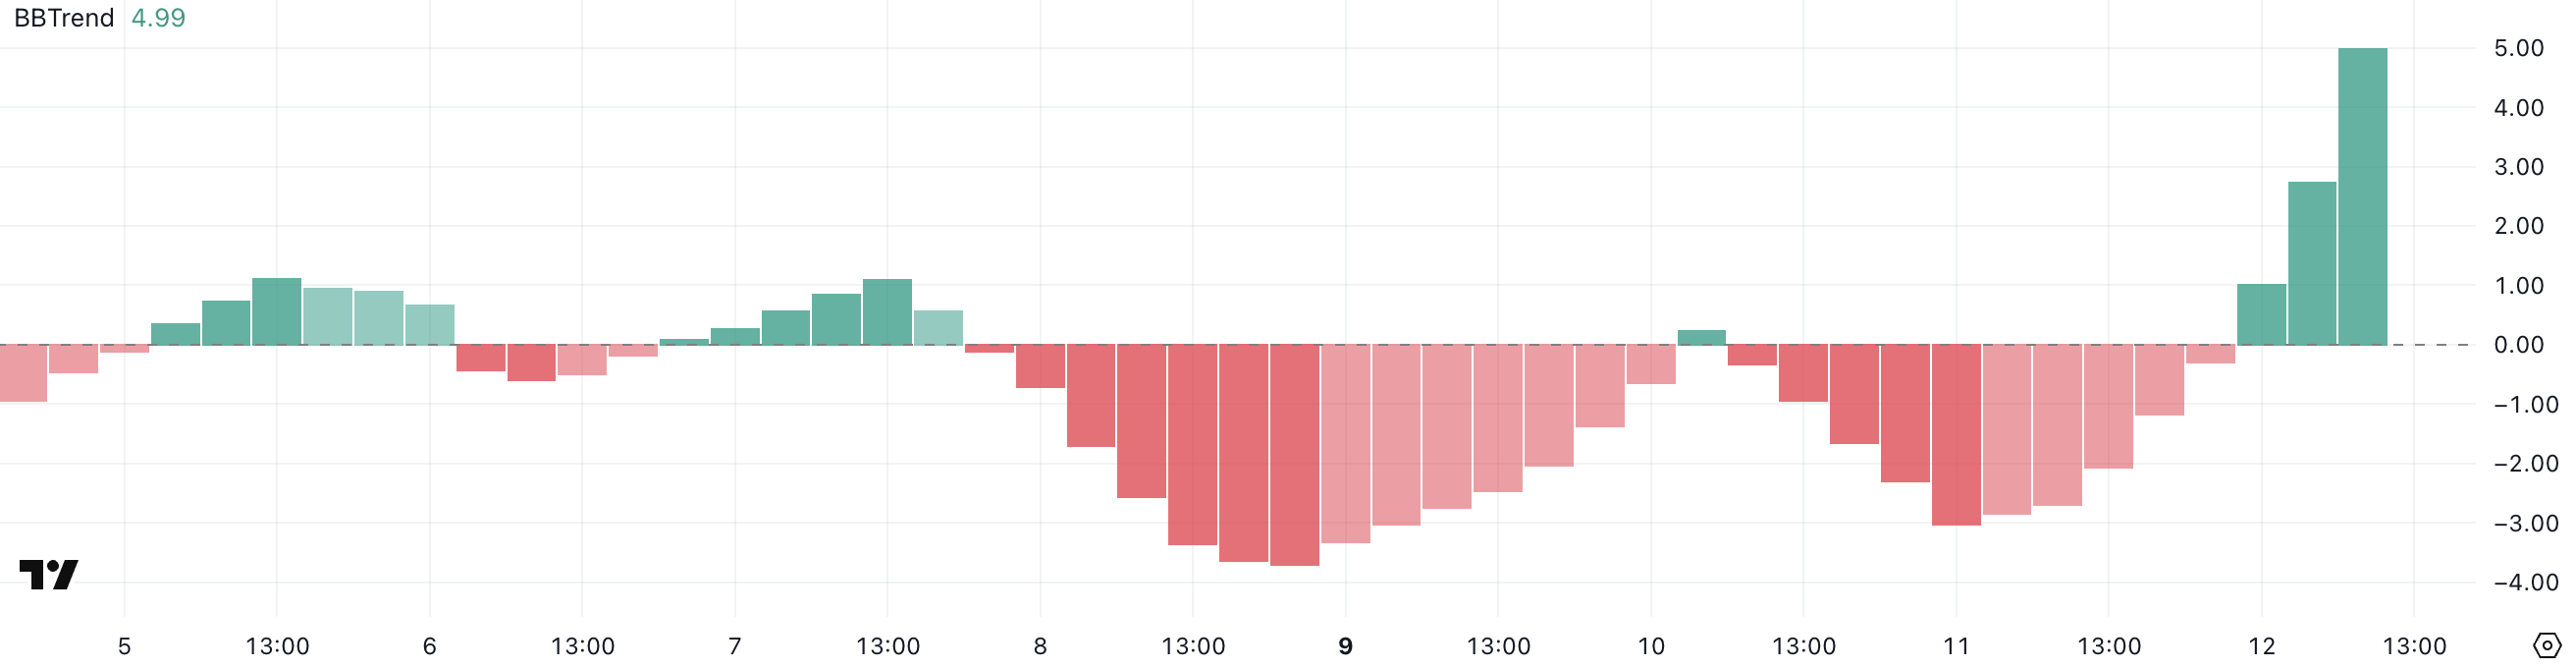 ETH BBTrend. Source:
TradingView.
ETH BBTrend. Source:
TradingView.
BBTrend, or Bollinger Band Trend, measures the directional strength of price movement relative to the Bollinger Bands. Values above 0 indicate upward momentum, while values below 0 suggest bearish pressure.
A reading around 4.99 indicates strong bullish momentum. If this trend holds or strengthens, it could signal further upside for ETH as traders interpret the move as a shift in market sentiment and positioning.
ETH Whale Count Declines for 7 Straight Days: Bearish Signal Ahead?
The number of Ethereum whales—wallets holding between 1,000 and 10,000 ETH—has steadily declined to 5,378, down from 5,427 just ten days ago and 5,400 three days ago.
This marks seven consecutive days of decline, which may reflect cautious behavior among large holders, despite Ethereum futures open interest recently hitting an all-time high.
These whales often gauge institutional or high-net-worth investor sentiment, and sustained reductions in their numbers typically indicate either profit-taking, risk reduction, or decreased confidence in near-term price action.
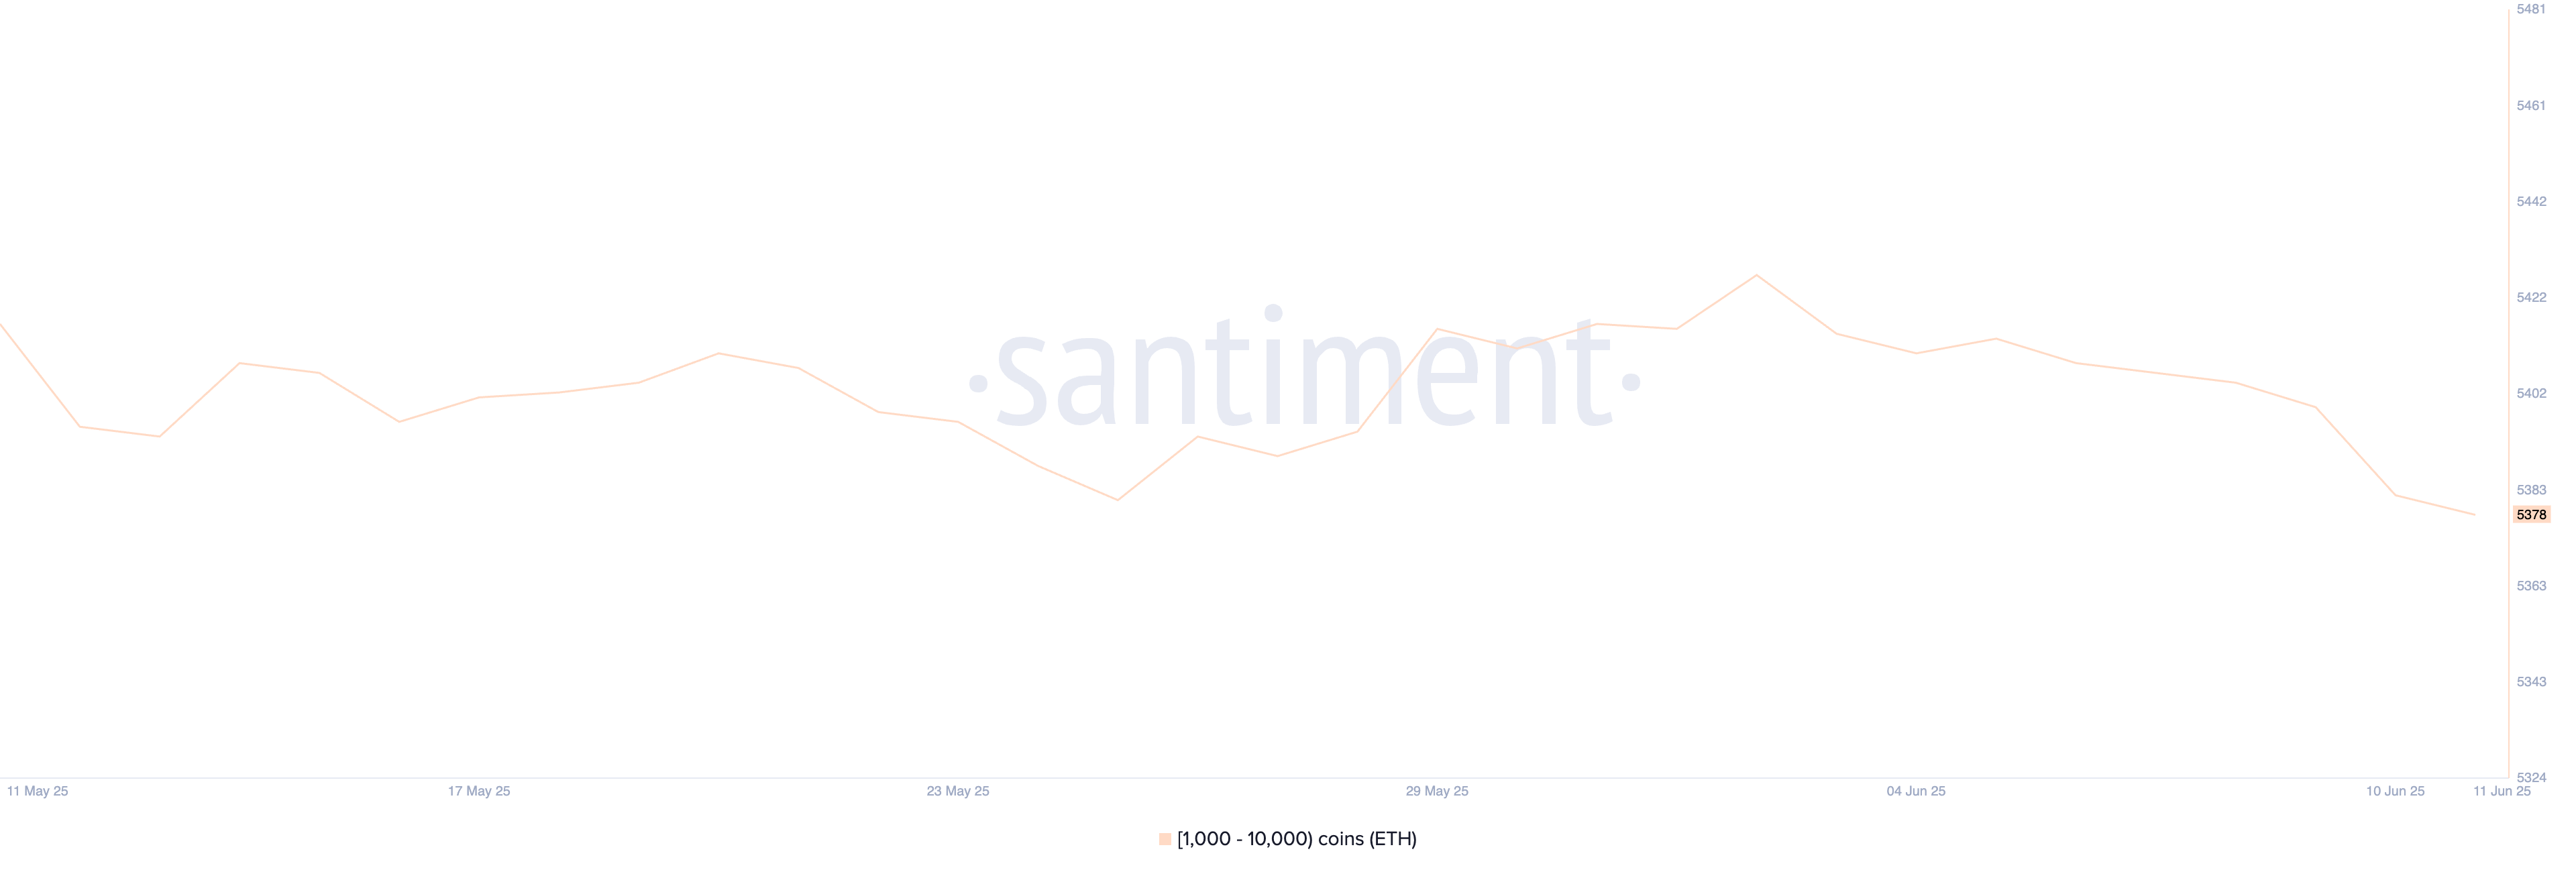 Ethereum Whales. Source:
Santiment.
Ethereum Whales. Source:
Santiment.
Tracking whale activity is crucial because these large addresses have the power to influence market trends through their trades. When whale counts increase, it’s often interpreted as accumulation, which can signal strong conviction in future price growth.
Conversely, a consistent decline—like what we’re seeing now—suggests that major holders may be offloading positions or refraining from buying.
This behavior can weaken price support and lead to increased volatility. If the downtrend in whale count continues, it could place downward pressure on ETH and increase the risk of a broader market pullback.
Ethereum Approaches Critical Support as $2,900 Resistance Holds
Ethereum recently failed to break through the resistance near $2,900 and is now trending lower, approaching a key support level at $2,679. If this support is tested and fails to hold, the next downside targets are $2,479 and potentially $2,326, especially if bearish momentum accelerates.
These levels are critical, as a confirmed break below them would indicate a shift in short-term market structure and could trigger further selling pressure.
With whale activity declining and market sentiment appearing cautious, Ethereum is now at a technical crossroads.
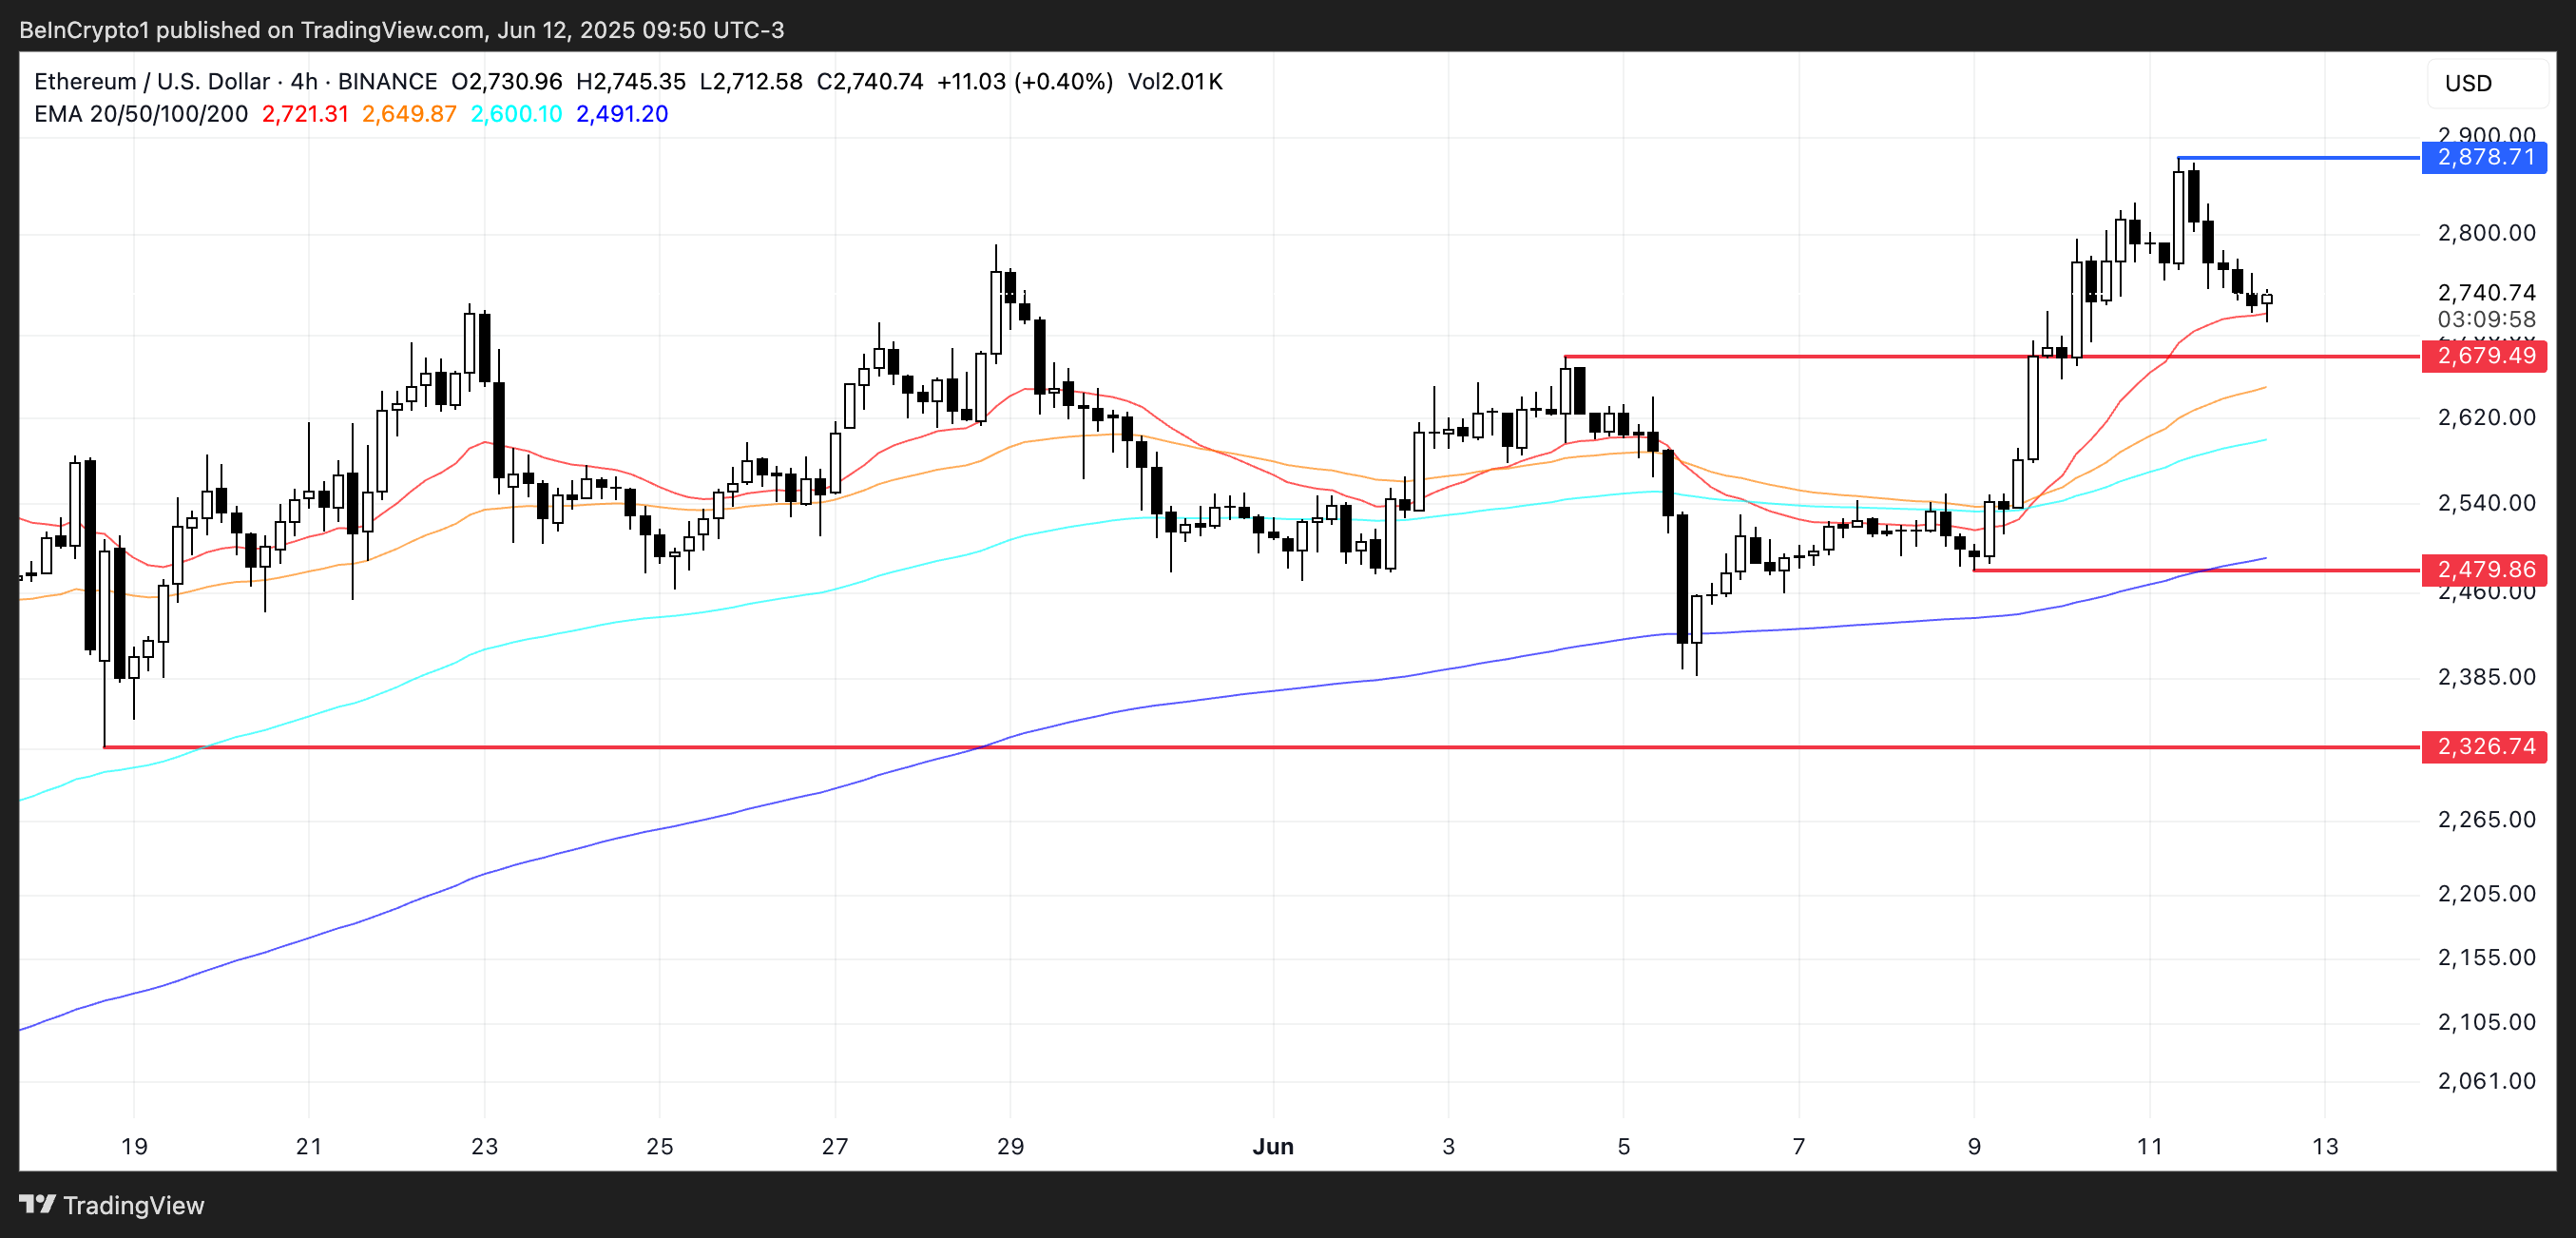 ETH Price Analysis. Source:
TradingView.
ETH Price Analysis. Source:
TradingView.
On the flip side, the BBTrend indicator has shown a strong bullish reversal, suggesting buying pressure may be building. If Ethereum regains momentum and successfully retests and breaks the $2,900 resistance, it could open the door for a rally toward $3,000—a level not seen since February 1.
Such a move would likely reinforce bullish sentiment and attract renewed interest from sidelined traders.
However, for that scenario to play out, bulls must first reclaim lost ground and flip $2,900 into a solid support zone.
Disclaimer: The content of this article solely reflects the author's opinion and does not represent the platform in any capacity. This article is not intended to serve as a reference for making investment decisions.
You may also like

Shiba Inu Holds $0.00001288 Support as $0.00001319 Resistance Limits Upside

Dogwifhat Trades at $0.88 as Price Holds $0.8771 Support While $0.9019 Resistance Caps Upside

Bitcoin ETF Inflows Hit $741M, Highest in 2 Months
Bitcoin ETFs saw $741M in inflows yesterday, marking the biggest surge in two months amid rising market optimism.Bullish Signals Amid Market VolatilityBitcoin ETFs Gaining Investor Trust