
XRP hits 7-week high above $2.39 as whale accumulation rises — What’s next for XRP price?

XRP climbed to a seven-week high above $2.39 on July 10, buoyed by rising investor interest and growing momentum among large holders.
According to data shared by Santiment on July 9, XRP ( XRP ) crossed $2.39 for the first time since May 23. There are now 2,742 wallets with at least one million XRP, a significant increase. Together, these wallets currently hold 47.32 billion XRP, a figure that represents growing confidence among major holders and ongoing accumulation close to the top of the supply distribution for XRP.
As of this writing, XRP is trading at $2.42, up 4% over the previous day and 7% over the previous week. The move coincides with a significant jump in trading volume, which climbed 74.1% in the last 24 hours to $4.54 billion.
The same pattern was seen in the activity of the derivatives market. According to Coinglass data , XRP’s volume increased by 77.68% to $9.95 billion, and its open interest increased by 10.12% to $5.62 billion, indicating an increase in speculative activity.
On the technical side, XRP’s recent breakout above the $2.40 zone has pushed the price beyond the upper Bollinger Band, often a sign of strong near-term momentum. The price is also holding comfortably above all major short- and mid-term moving averages, including the 10, 20, 50, 100, and 200-day exponential and simple averages.
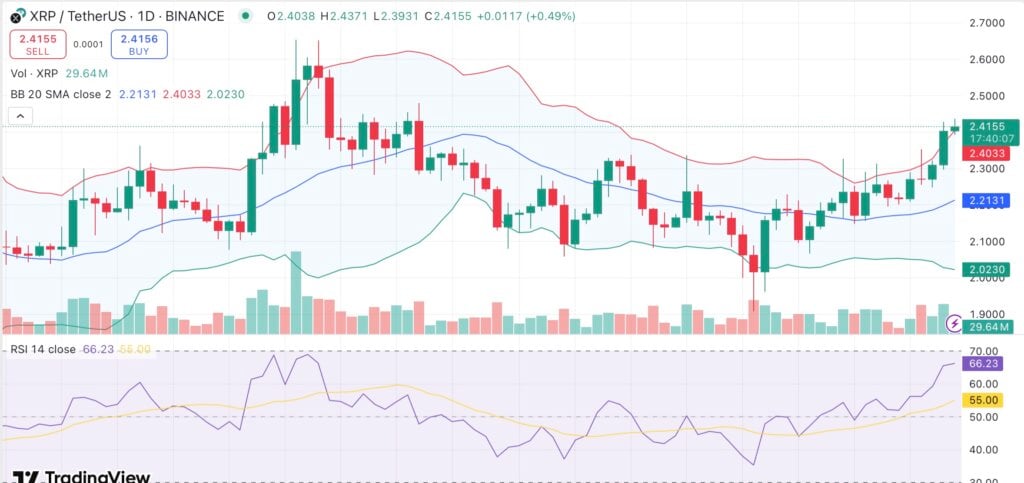 XRP price analysis. Credit: crypto.news
The relative strength index, at 66, shows significant momentum without yet reaching overbought territory. The MACD is still expanding and in positive territory, which is a sign of trend continuation rather than reversal. Volume has increased in tandem with the rally, supporting the validity of the breakout.
The Bollinger Bands width has widened, indicating increased volatility, often seen during the early stages of larger price moves. Nevertheless, since short-term oscillators such as the stochastic RSI are nearing their peak levels, it is impossible to rule out the possibility of a brief cooldown.
The next area to watch would be close to $2.50, followed by the May highs around $2.63, if bulls can keep XRP above the $2.40 breakout level. This scenario is supported by steady accumulation from large holders and increasing trading volume.
But if the price falls back below $2.30, it could be a sign of a failed breakout and signal a drop toward the 20-day moving average, which is near $2.21. This would probably raise doubts about the overall trend, particularly if volume begins to taper off.
Disclaimer: The content of this article solely reflects the author's opinion and does not represent the platform in any capacity. This article is not intended to serve as a reference for making investment decisions.
You may also like
Will the market perform best in the last two months of this year? Should we rush in now or exit?
If the four-year cycle theory is dead, how much further can bitcoin rise in this round?
Bitcoin Weekly Watch | Bulls and Bears to Face Off, Direction to Be Decided This Week!

Bitcoin ‘ping-pong’ price action will stick until Fed FOMC and US-China deal wrap up
Which were the best-performing months of the year? Should I hodl or sell during this bullish run?