- Ethereum moved above $2950 after weeks of sideways action and could soon push toward the $4000 zone.
- The breakout came after a classic cup and handle pattern that built across several months of 2025.
- RSI and trend structure both confirm positive momentum as ETH aims to stay above the rising support line.
Ethereum (ETH) surged past $2,950 on July 14, 2025, signaling a bullish breakout from a multi-month cup and handle formation. The move followed a long period of sideways consolidation between $2,550 and $2,950. Traders are now watching closely as ETH eyes a major resistance at $4,000, the projected move from the breakout structure.
 Source:
X
Source:
X
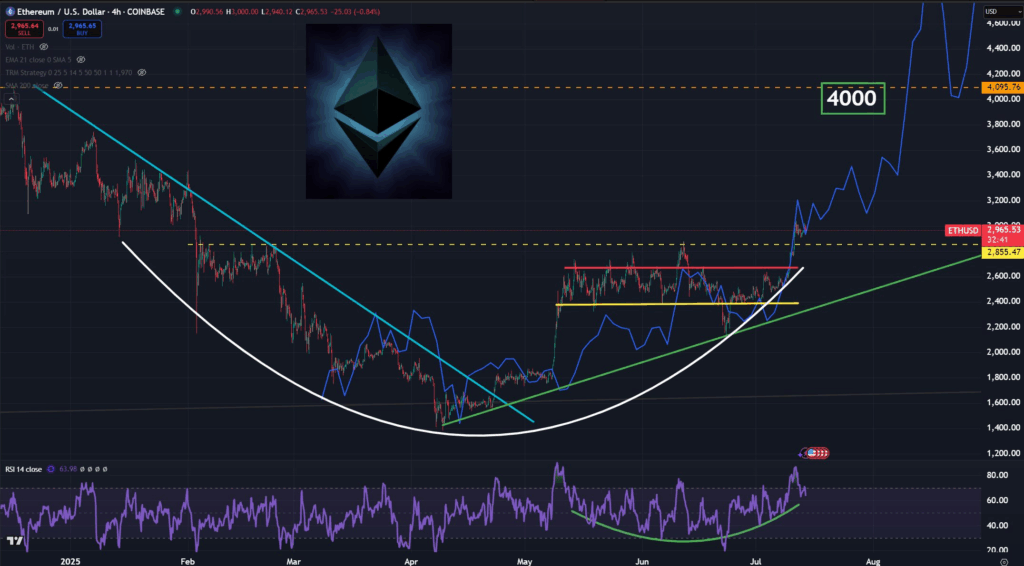
The chart, shared by analyst TommyJR on X, depicts Ethereum’s reversal from a steep downtrend into a structured recovery. A large, white curved arc traces a classic cup pattern beginning in early 2025. The handle consolidation is marked by a rectangular channel between $2,550 and $2,950 before the current breakout occurred.
On the 4-hour timeframe using Coinbase data, ETH appears to be following a projected path pointing toward the $4,000 mark. A blue trend projection arrow indicates price movement climbing above $3,800 in the coming weeks. The RSI shows strength, recently moving above 63, with an upward slope signaling improving momentum.
Ethereum Breakout From Major Structure
Ethereum’s price action through 2025 has been defined by a prolonged downtrend followed by a sharp recovery. The downward-sloping resis t ance line, visible from January through April, was breached mid-year. That breakout gave way to the formation of a large cup and handle, often seen as a bullish continuation pattern.
Between May and early July, Ethereum traded within a horizontal range, building the “handle” of the pattern. The key support held near $2,550, while resistance near $2,950 was tested several times. As of mid-July, the upper boundary has been broken with a strong move upward.
The green ascending trendline confirms price stability throughout the recovery. It acts as dynamic support and aligns with the handle zone. The price has respected this trend since the pattern’s low near $1,500 earlier in the year. With multiple indicators confirming the breakout, Ethereum may be setting up for its next leg higher.
Community Insight and Price Targets
Analyst TommyJR reacted to the price action by referencing Ethereum’s strength and composure. In his post, he wrote, “$ETH you stay classy Ethereum Foundation,” indicating confidence in ETH’s technical progression. The post reached over 4,000 views in under 24 hours and engaged a wide crypto audience.
Traders are now closely monitoring Ethereum’s ability to maintain price action above the $2,950 breakout zone. Sustained closes above this mark would validate the pattern and increase probability of reaching the $4,000 zone. The blue projection on the chart reflects a steep incline once Ethereum clears $3,000 with volume.
The yellow dashed lines suggest historical areas of price interaction, particularly between $2,855 and $2,950. These now serve as key short-term support. Meanwhile, the RSI’s trend, shaped by a green arc, mimics the price structure, adding weight to the bullish continuation narrative.
Will Ethereum Hit $4,000 Before August?
Ethereum’s cup and handle breakout targets the $4,000 mark — a level not seen since late 2021. With momentum accelerating, the breakout structure implies bullish continuation, though some consolidation may occur near $3,200.
If ETH holds the breakout zone near $2,950, it could trigger increased institutional and retail interest. The chart indicates that a move above $3,500 could happen swiftly if buying pressure increases.
The trajectory remains upward as long as ETH sustains price action above the green trendline and avoids sharp corrections below $2,850.