Date: Thu, July 17, 2025 | 05:48 AM GMT
The cryptocurrency market has entered bullish territory, with Ethereum (ETH) leading the charge with its impressive 21% weekly gains, having crossed the $3,350 mark. This wave of bullishness is lifting major altcoins — and Aave (AAVE) is now flashing signs of joining the rally.
The DeFi token has jumped 7% over the past week, but what’s catching even more attention is the emergence of a technical setup on the chart — signaling a potential upside move.
 AAVE Daily Chart/Coinsprobe (Source: Tradingview)
ABC Zigzag Pattern in Play?
AAVE appears to be in the early stages of forming a classic ABC Zigzag corrective wave pattern — and if this plays out, the token may be gearing up for a powerful leg higher. The move from $114.16 to $317.68 marked Wave (A), showing a strong bullish impulse. This was followed by a healthy pullback to $213.25, completing Wave (B). Now, AAVE is climbing again, suggesting Wave (C) is underway — the final leg of the pattern, typically another impulsive upward move.
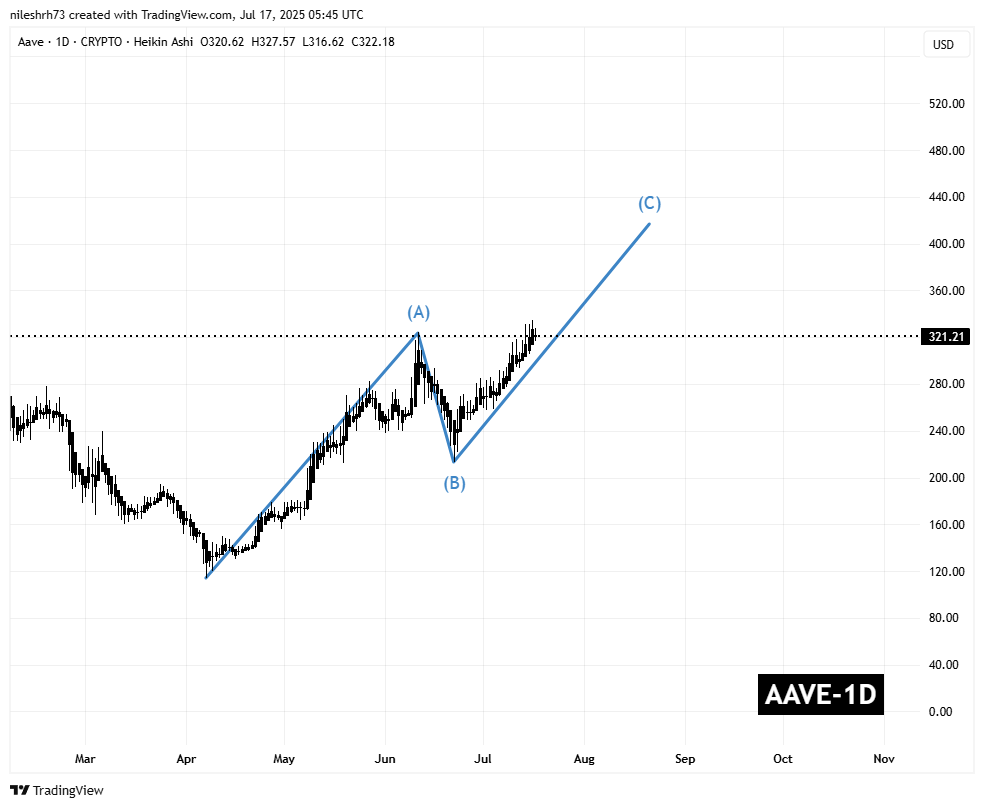 AAVE Daily Chart/Coinsprobe (Source: Tradingview)
If this structure continues to unfold as expected, AAVE could be heading toward a target range between $416 and $542. These levels represent the 1.0x and 1.618x Fibonacci extensions of Wave A, often used to project the end of Wave C. From the current price around $322, this move could bring gains of nearly 29% to 68% — if the bullish sentiment continues.
What’s Next?
For the bullish outlook to remain intact, AAVE needs to hold above the $323.56 level, which closely aligns with the peak of Wave (A). Sustaining this level would likely confirm the structure and open the doors for further upside. However, if the price drops below $300, it could temporarily delay the rally or lead to some consolidation.
With momentum building and technical patterns aligning, AAVE could be preparing for a strong rally — but as always, traders should remain cautious and watch for confirmations.