Date: Wed, July 23, 2025 | 02:40 PM GMT
The cryptocurrency market is cooling after a strong multi-week rally, with Ethereum (ETH) sliding to $3,600 from a recent peak of $3,858. This softer momentum is affecting several major memecoins, including Pepe (PEPE).
PEPE has dipped 3% today, trimming its monthly gains to 44%. Yet, beneath the surface, a potentially bullish fractal pattern is forming — one that closely resembles the breakout structure recently seen in PENGU.
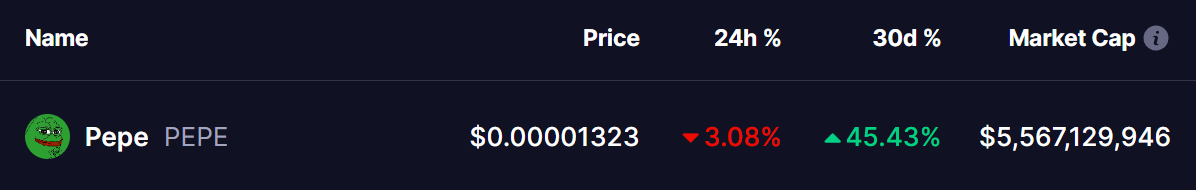 Source: Coinmarketcap
PEPE Mirrors PENGU’s Breakout Setup
A side-by-side comparison of PEPE and PENGU daily charts reveals a remarkably similar price trajectory.
PENGU, after forming a falling wedge — a classic bullish reversal pattern — reclaimed its 50-day and 100-day moving averages. These levels served as a launchpad, allowing PENGU to consolidate between red and blue zones before unleashing a 172% multi-leg surge.
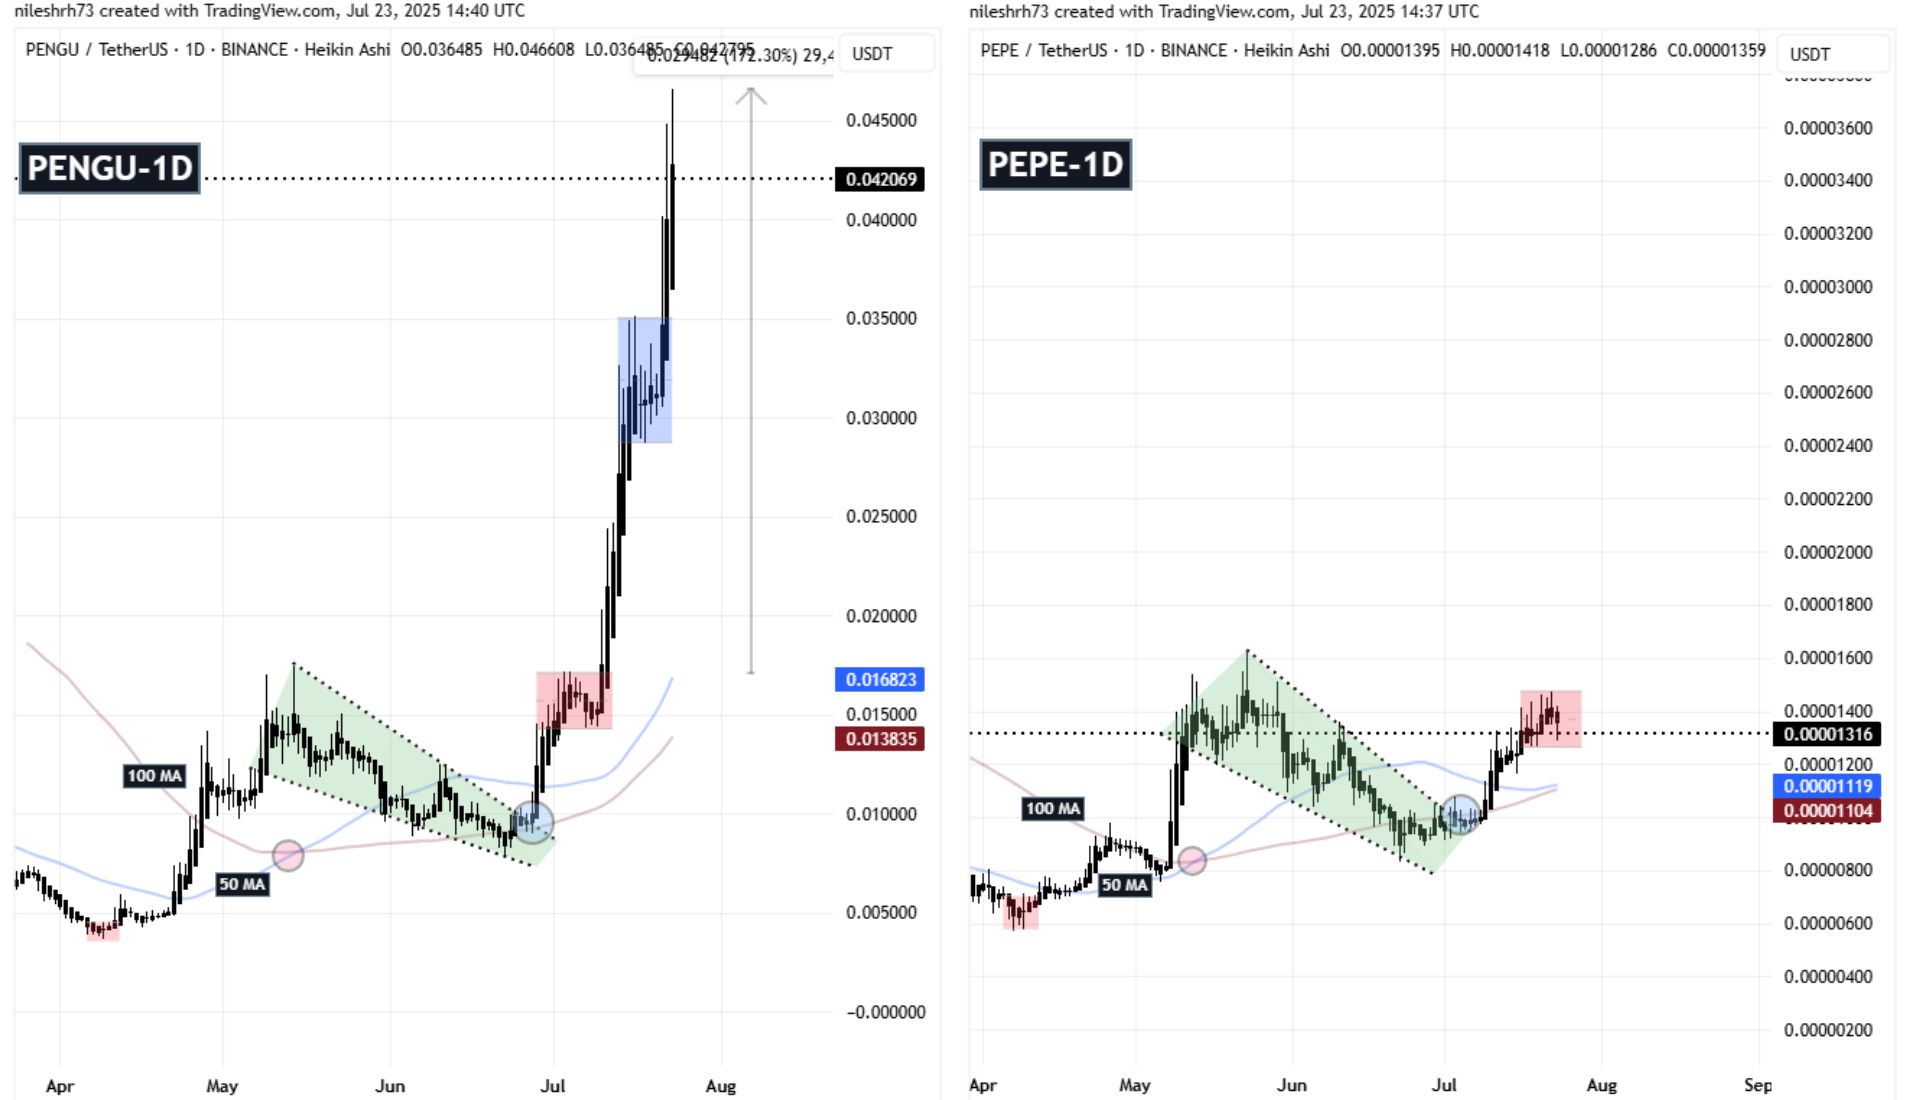 PENGU and PEPE Fractal Chart/Coinsprobe (Source: Tradingview)
Now, PEPE appears to be following the same path.
Like PENGU, PEPE has broken out of its falling wedge and reclaimed both its 50-day and 100-day MAs. It’s currently consolidating within the red resistance zone — the same point where PENGU gathered strength before its explosive rally. This type of fractal setup, where one chart structure echoes another, often hints at similar future outcomes.
What’s Next for PEPE?
If this fractal continues to play out, a breakout above the red resistance zone could ignite PEPE’s next leg up, potentially targeting $0.000040 — a move that mirrors PENGU’s 172% surge from similar conditions.
Disclaimer: This article is for informational purposes only and not financial advice. Always conduct your own research before investing in cryptocurrencies.