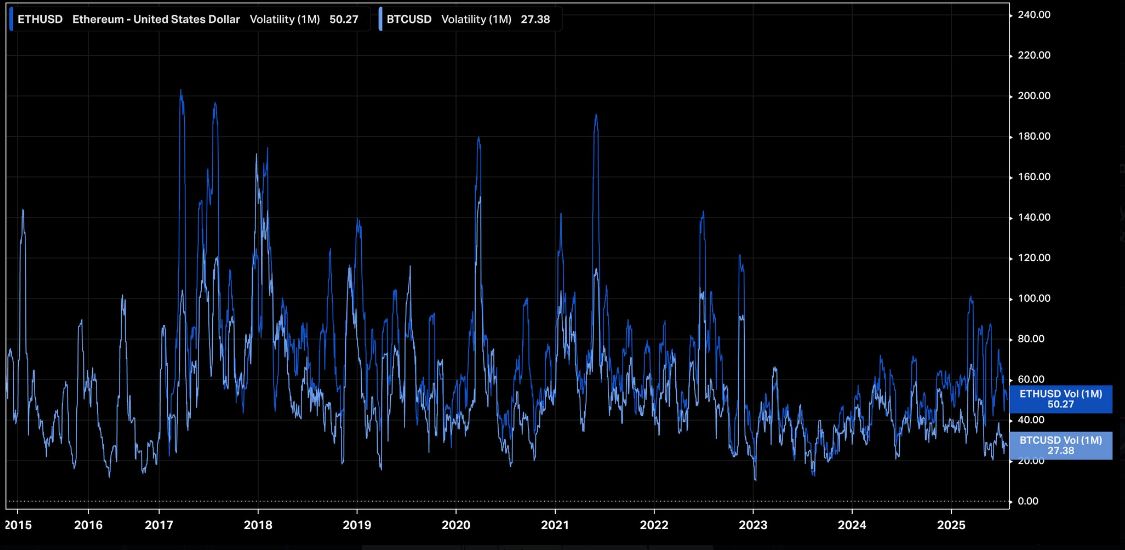
- Ethereum’s month over month volatility reaches 50.27, almost double the 30 day volatility of Bitcoin at 27.38, indicating larger and more frequent price swings.
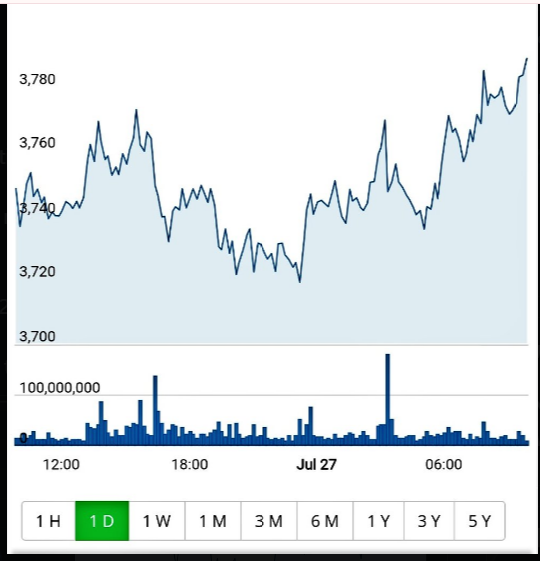
- ETH price range bound at $3,721-$3,798 above the key support while testing the short-term resistance point near the daily high.
- Intraday activity remains high, with volume spikes suggesting concentrated trading, despite narrow overall daily price movement.
The market action of Ethereum in recent weeks shows that Ethereum was more volatile than Bitcoin, and the change in prices has been closely watched. Measured in volatility: over 30 days, ETH has a volatility of 50.27, which is almost twice such an indicator of Bitcoin (certainly in such a concise period of time) with a volatility level of 27.38.
Although both assets remain calmer than in earlier years, Ethereum’s price activity remains distinctly more dynamic. At the time of writing (July 27), the price of ETH was at $3,769.02, and has increased by 0.3 percent over the past 24 hours. The daily range fluctuations range between the low of 3700 and the high of 3798.70, implying moderately low volatility despite the large volatility measure. The asset is supported at 3,721.39.
ETH Price Remains Active Within Tight Range
Ethereum’s intraday chart shows consistent fluctuations, with the price touching both ends of its daily range multiple times. Activity began around $3,740 and briefly dipped to levels near $3,700 before recovering. By early July 27 morning, the price had broken past $3,780. However, resistance near $3,798.70 capped further upside.
 Source: (X)
Despite these swift price moves, ETH has stayed within a $100 range, which aligns with its broader volatility pattern. Trading volume also shows intermittent spikes, suggesting short bursts of buying or selling interest. Volume peaks during mid-session hours highlight concentrated activity windows. These patterns continue to support elevated monthly volatility, even as the daily price change remains relatively muted.
Ethereum’s Volatility Nearly Doubles Bitcoin’s
There has been a significant increase in the one-month volatility gap between Ethereum and Bitcoin. As Ethereum stands at 50.27 and Bitcoin at 27.38 the price dynamics of ETH demonstrate nearly twice as much variability. The trend stretched across several months, and ETH has consistently been leading BTC in the intensity of movement during this period.
 Source: (X)
The long-term data representation shows that both assets experienced a general decrease in volatility when compared to 2017021. Nevertheless, Ethereum is still demonstrating more acute and frequent price responses over brief periods.
The notable pattern seen highlights the overall propensity of the asset towards more pronounced reversals intraday, despite the overall trends being stable. This less dramatic movement of BTC makes it categorized within a different volatility profile. Its present sideways movement is compared to the sharper movements and declines within Ethereum within the same time-frame.
Support Holds as Short-Term Range Consolidates
Currently, Ethereum holds just above its support level of $3,721.39, maintaining short-term consolidation. The support zone has held across multiple dips , keeping the price structure stable for now. If resistance at $3,798.70 remains intact, ETH could stay confined to its existing range.
Further confirmation will depend on whether intraday momentum continues toward either threshold. In the meantime, the volatility spread between ETH and BTC remains a relevant factor for traders monitoring risk exposure.