Pi Coin Reversal in Sight? 3 Bullish Patterns Suggest It Might Be

Pi Coin has been stuck in a tight range, but signs of a bullish reversal are emerging. A surge in volume, strengthening momentum, and a key candle setup could mark the turning point.
Pi Coin (PI) has been frustrating traders for weeks, oscillating between narrow ranges and exhibiting little momentum in either direction. Over the past seven days, PI price has slipped only 0.5%, trading at around $0.448.
On the monthly timeframe, Pi Coin price is down 15%, while its three-month decline sits at a deeper 23%. The sluggish price action has kept bulls and bears in a stalemate. But as July draws to a close, a shift may be brewing beneath the surface.
Volume-Based Confirmation: OBV Starting to Shift!
The On-Balance Volume (OBV) indicator is showing early signs of bullish intent. Between July 13 and 22, the Pi Coin price had a decent uptick. The OBV indicator mirrored this move with a higher high.
This synchronicity between price and volume suggests that the price surge wasn’t a fluke; real buying volume backed the move.
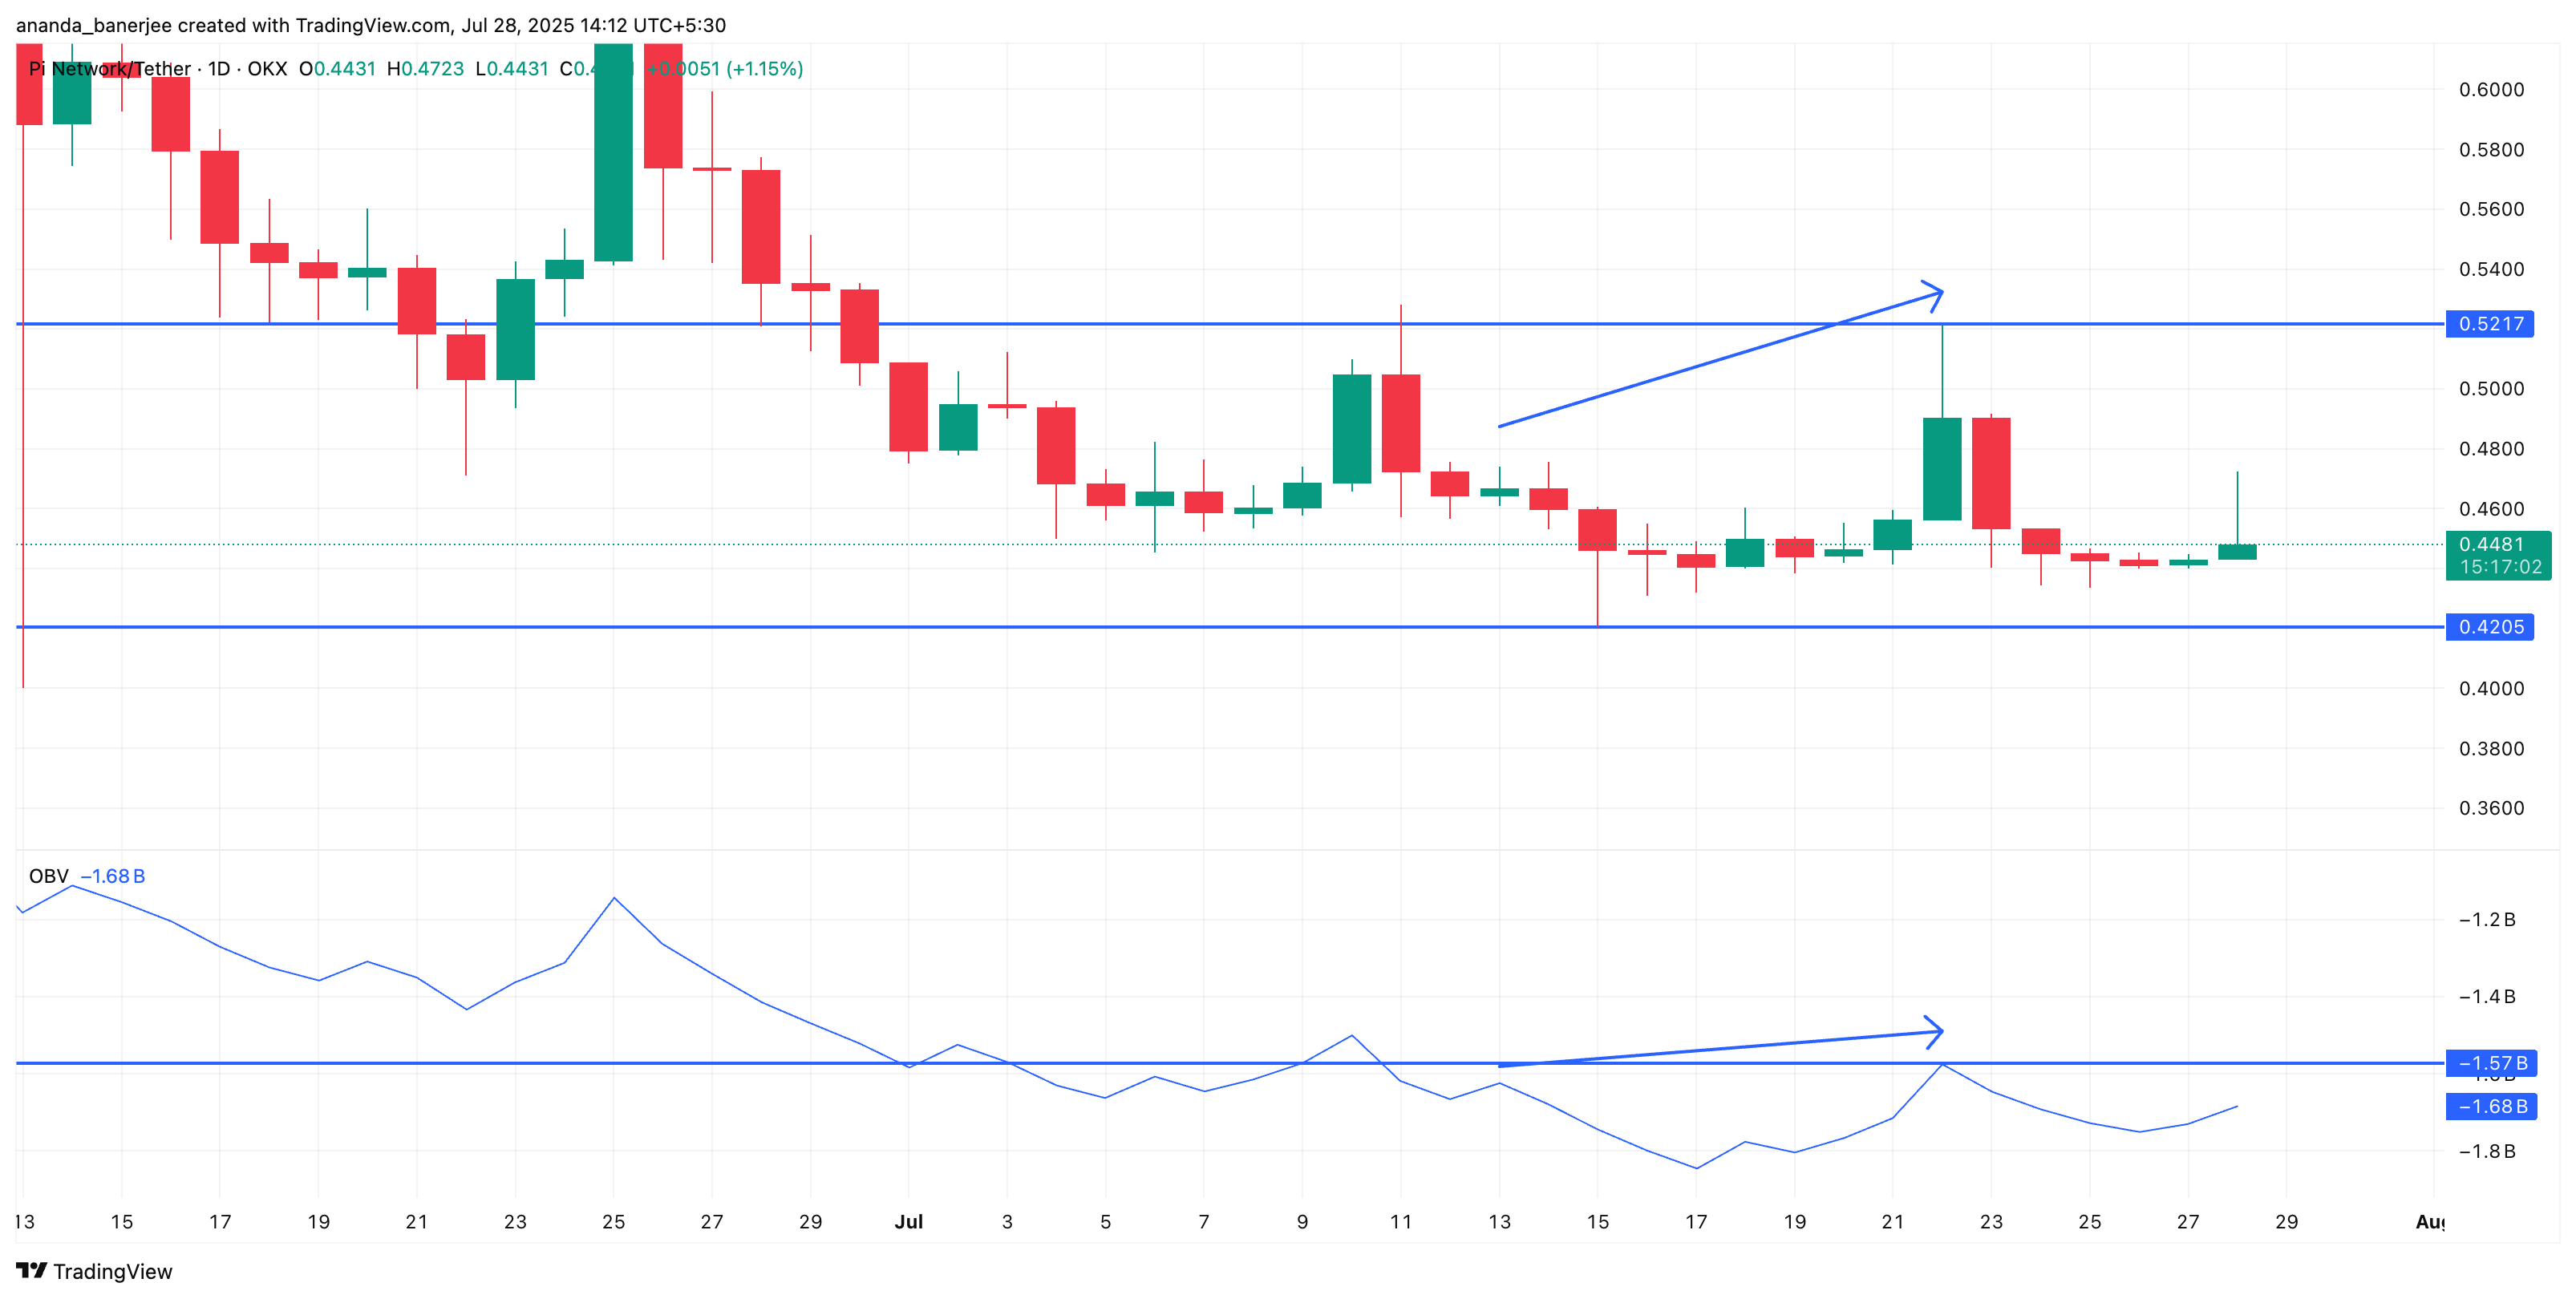 Pi Coin price and OBV support:
However, that strength still needs validation. For the OBV to confirm a trend continuation, it must surpass the previous peak of -1.57 billion. A higher high on the OBV would signal sustained accumulation, reinforcing the case for a broader bullish reversal.
As a cumulative volume-based indicator, OBV adds volume on green days and subtracts it on red days. When it trends higher with price, it confirms bullish conviction. When it flattens or diverges, momentum is suspect. Right now, OBV is building, but hasn’t yet broken out.
Pi Coin’s RSI Divergence Aligns with OBV Momentum
The Relative Strength Index (RSI) is also showing signs of life. While the PI price has continued to print lower highs, the RSI has been on an upward trajectory. This bullish divergence suggests that bearish pressure is waning; a divergence between price and underlying strength.
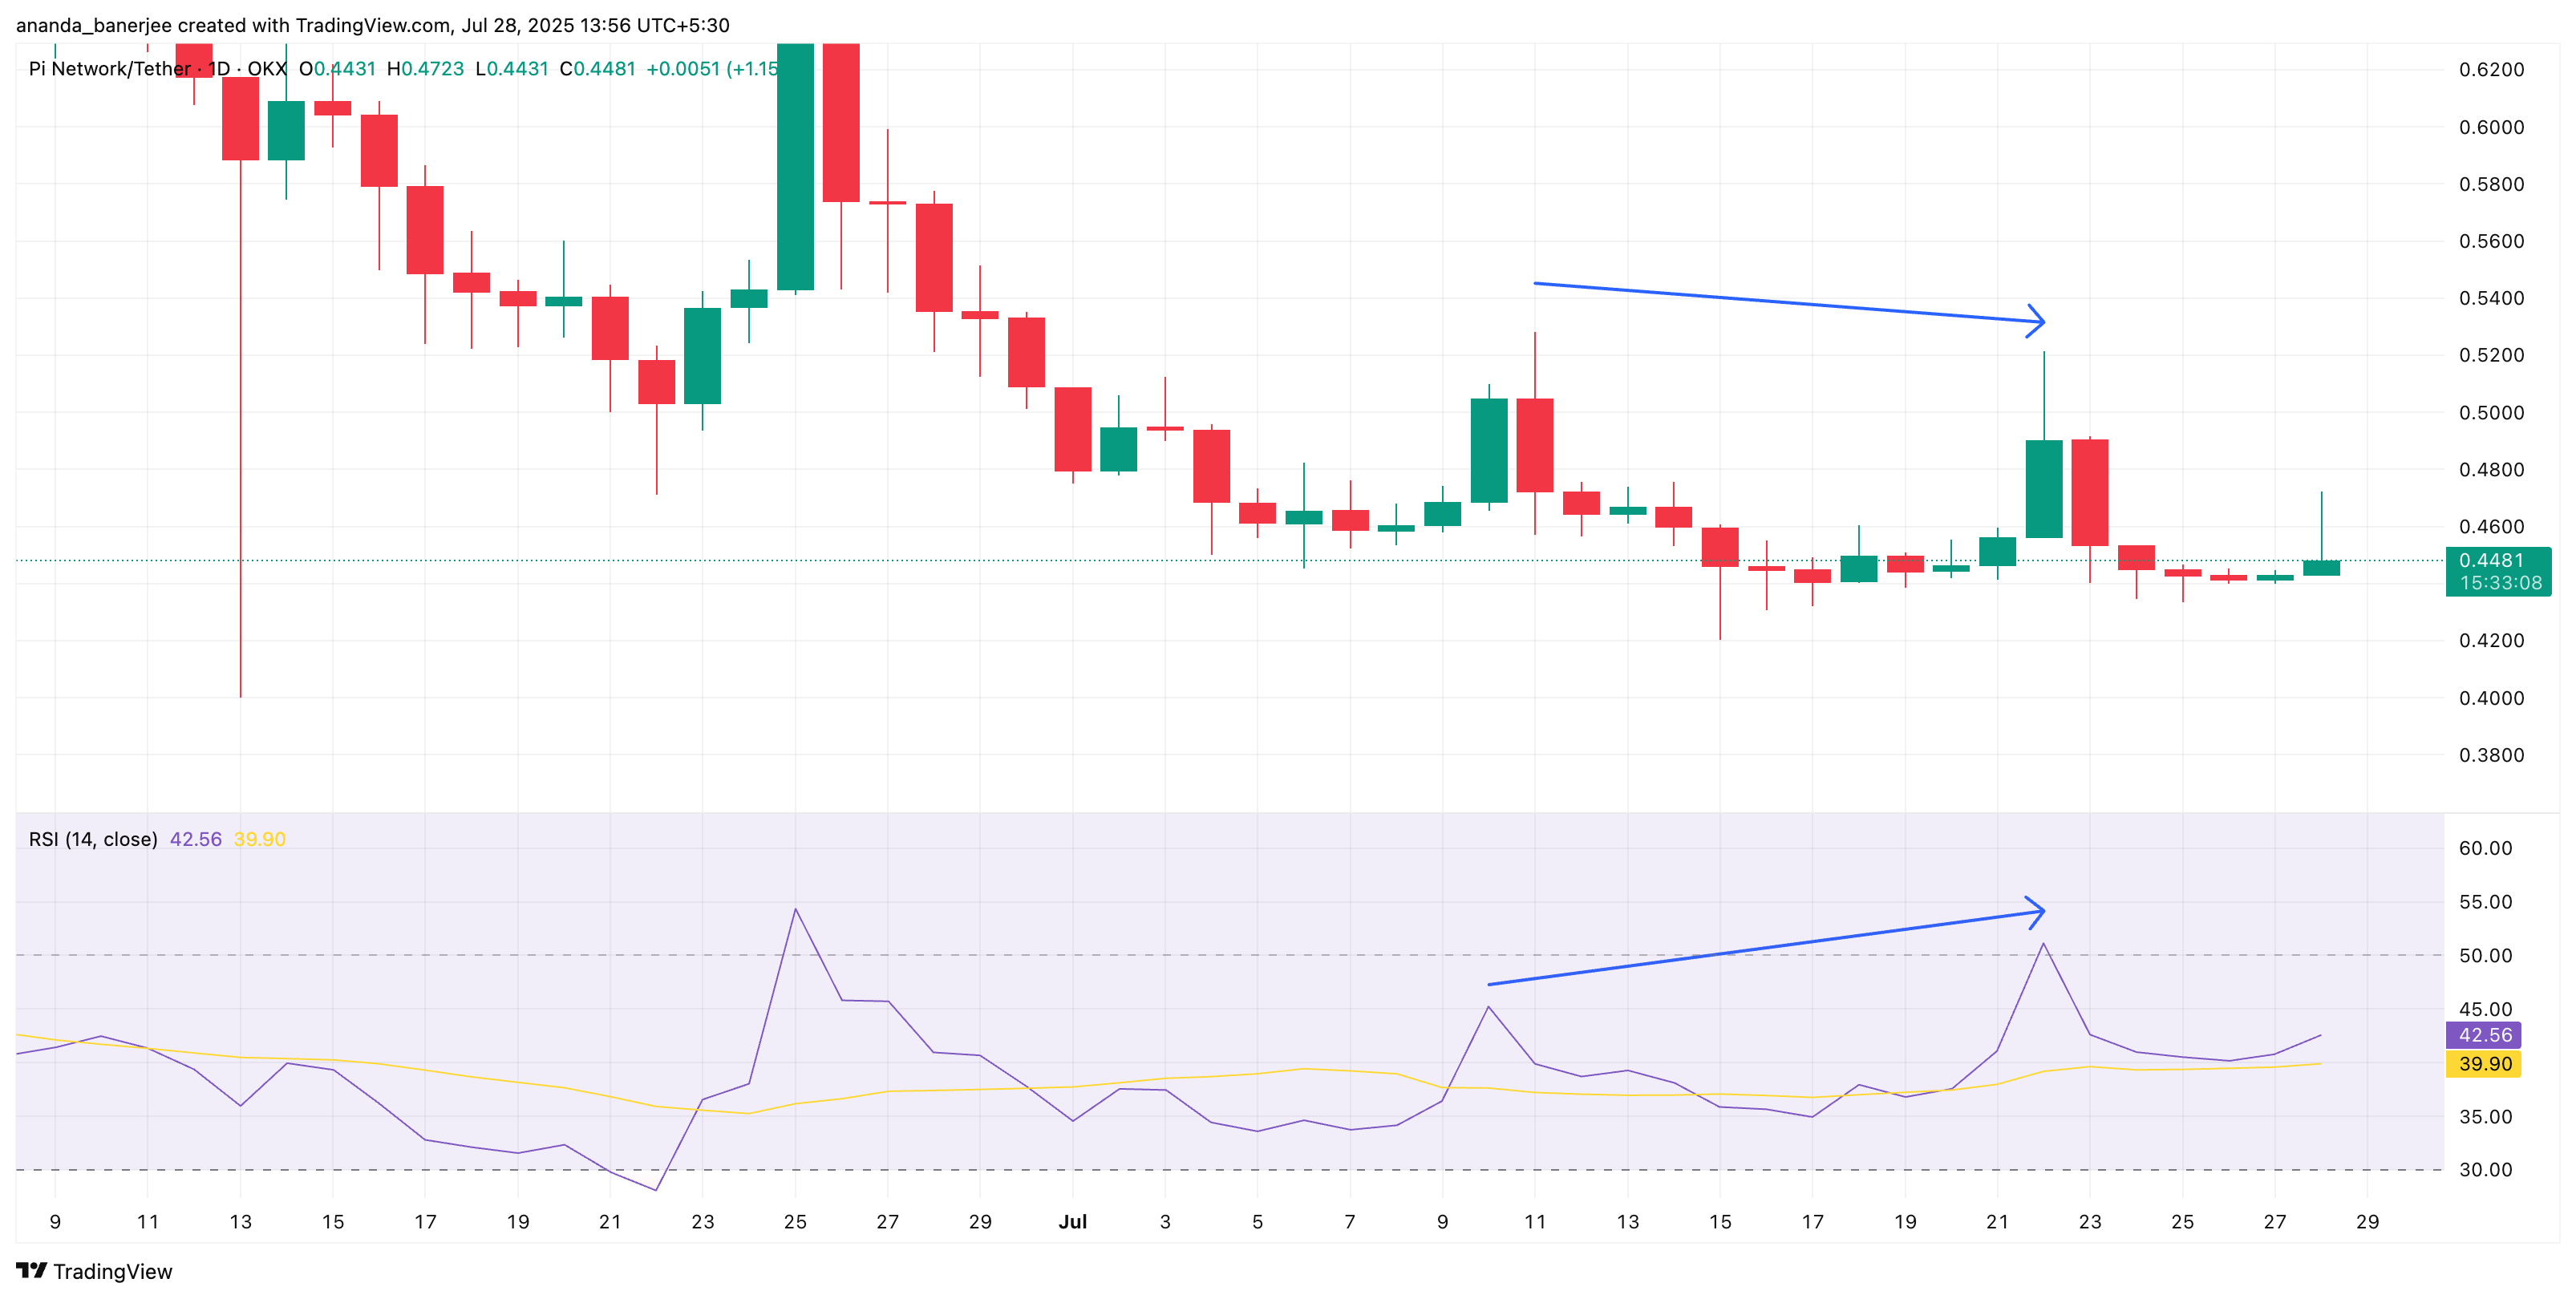 PI price and RSI divergence:
That said, for this signal to solidify, the RSI must move past the 52 level. Closing above 52 would imply that bullish momentum is not just bubbling; it’s breaking through. Until then, the divergence remains promising, but unconfirmed. A move above 52 would mean two higher highs forming, indicating reversal-like bullishness.
RSI tracks momentum by comparing the magnitude of recent gains to recent losses. Divergences between RSI and price, especially near major support zones, often precede trend reversals.
For token TA and market updates: Want more token insights like this? Sign up for Editor Harsh Notariya’s Daily Crypto Newsletter here.
Candle Confirmation: Inverted Hammer Adds Weight To PI Price Reversal!
The final bullish cue comes from a candlestick pattern. On July 28, Pi Coin printed a green inverted hammer, a candlestick with a small real body near the low and a long upper wick, suggesting a failed breakout or testing of resistance. This pattern typically emerges after a downtrend, hinting at a potential bullish reversal, but only if confirmed by a strong follow-up candle.
While buyers pushed prices sharply higher intraday, they couldn’t hold the gains. Still, the close above the open (green body) shows some intraday strength. What matters now is confirmation: a solid green candle that breaks above the wick high. Without that, it remains just a potential reversal, not a guaranteed one.
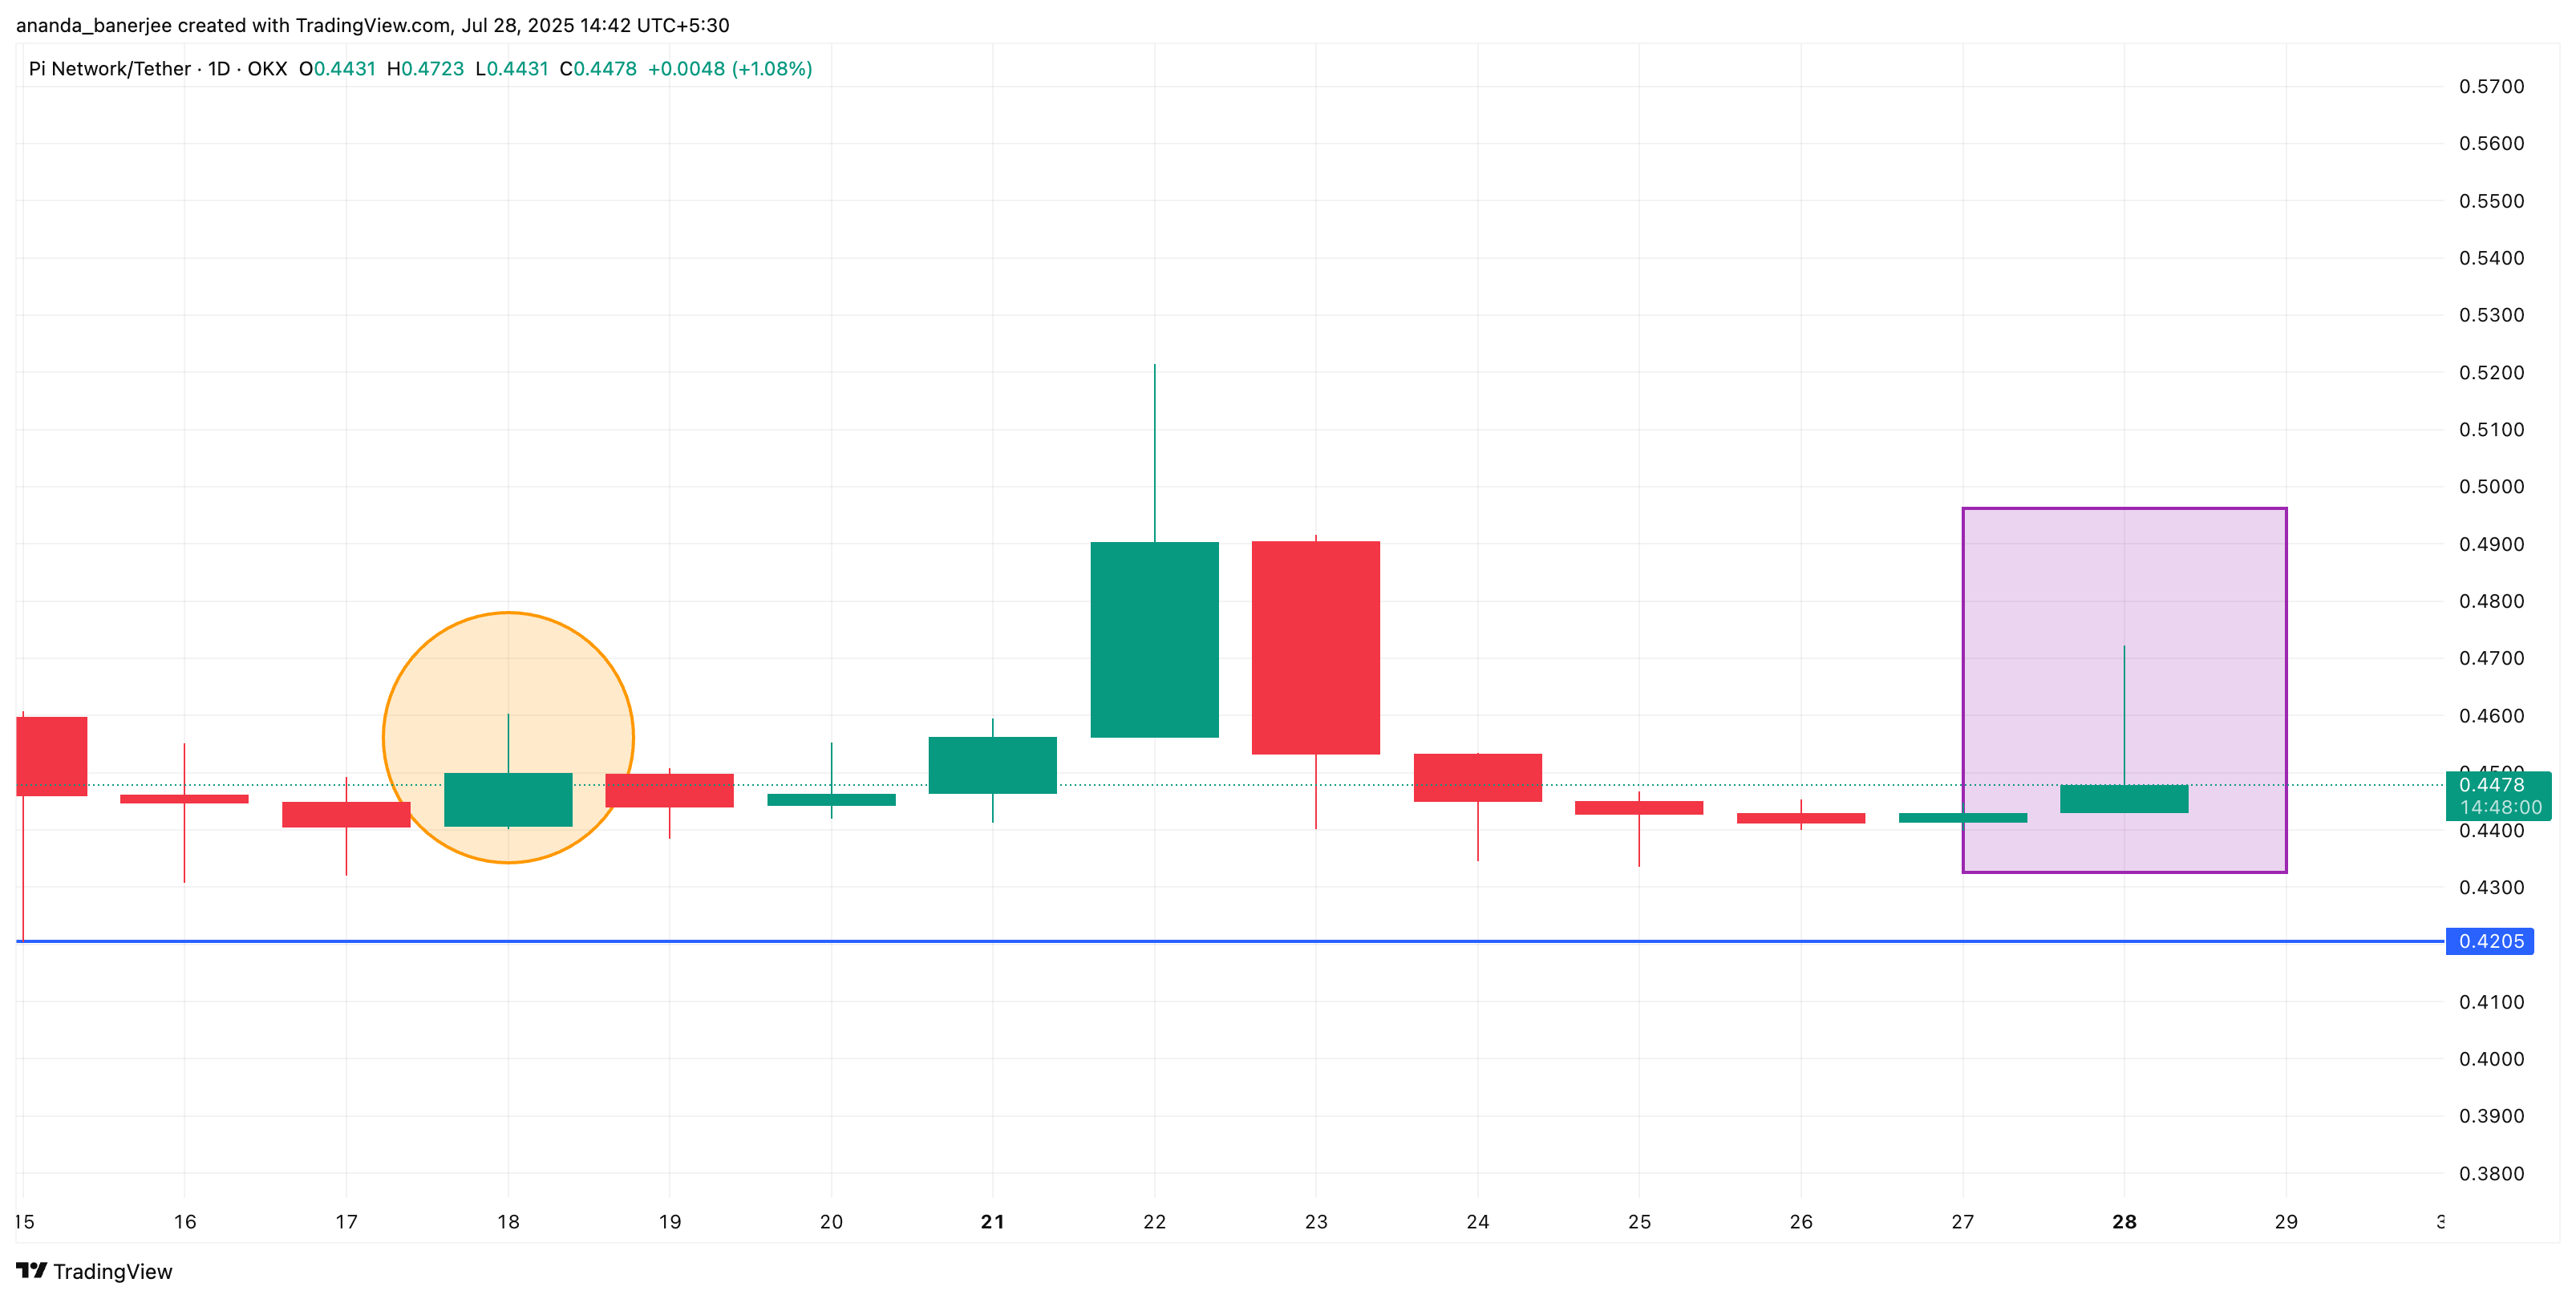 Pi Coin and the bullish inverted hammer:
This isn’t the first time Pi has shown this behavior; a similar setup on July 18 preceded a sharp rally from $0.439 to $0.521 within four sessions.
Where Does Pi Coin Price Go From Here?
The bullish trifecta, rising OBV, RSI divergence, and inverted hammer, points toward a potential reversal. But confirmation remains key. If the Pi Coin price breaks above the $0.47 mark (0.5 Fibonacci retracement), a retest of $0.52 looks plausible.
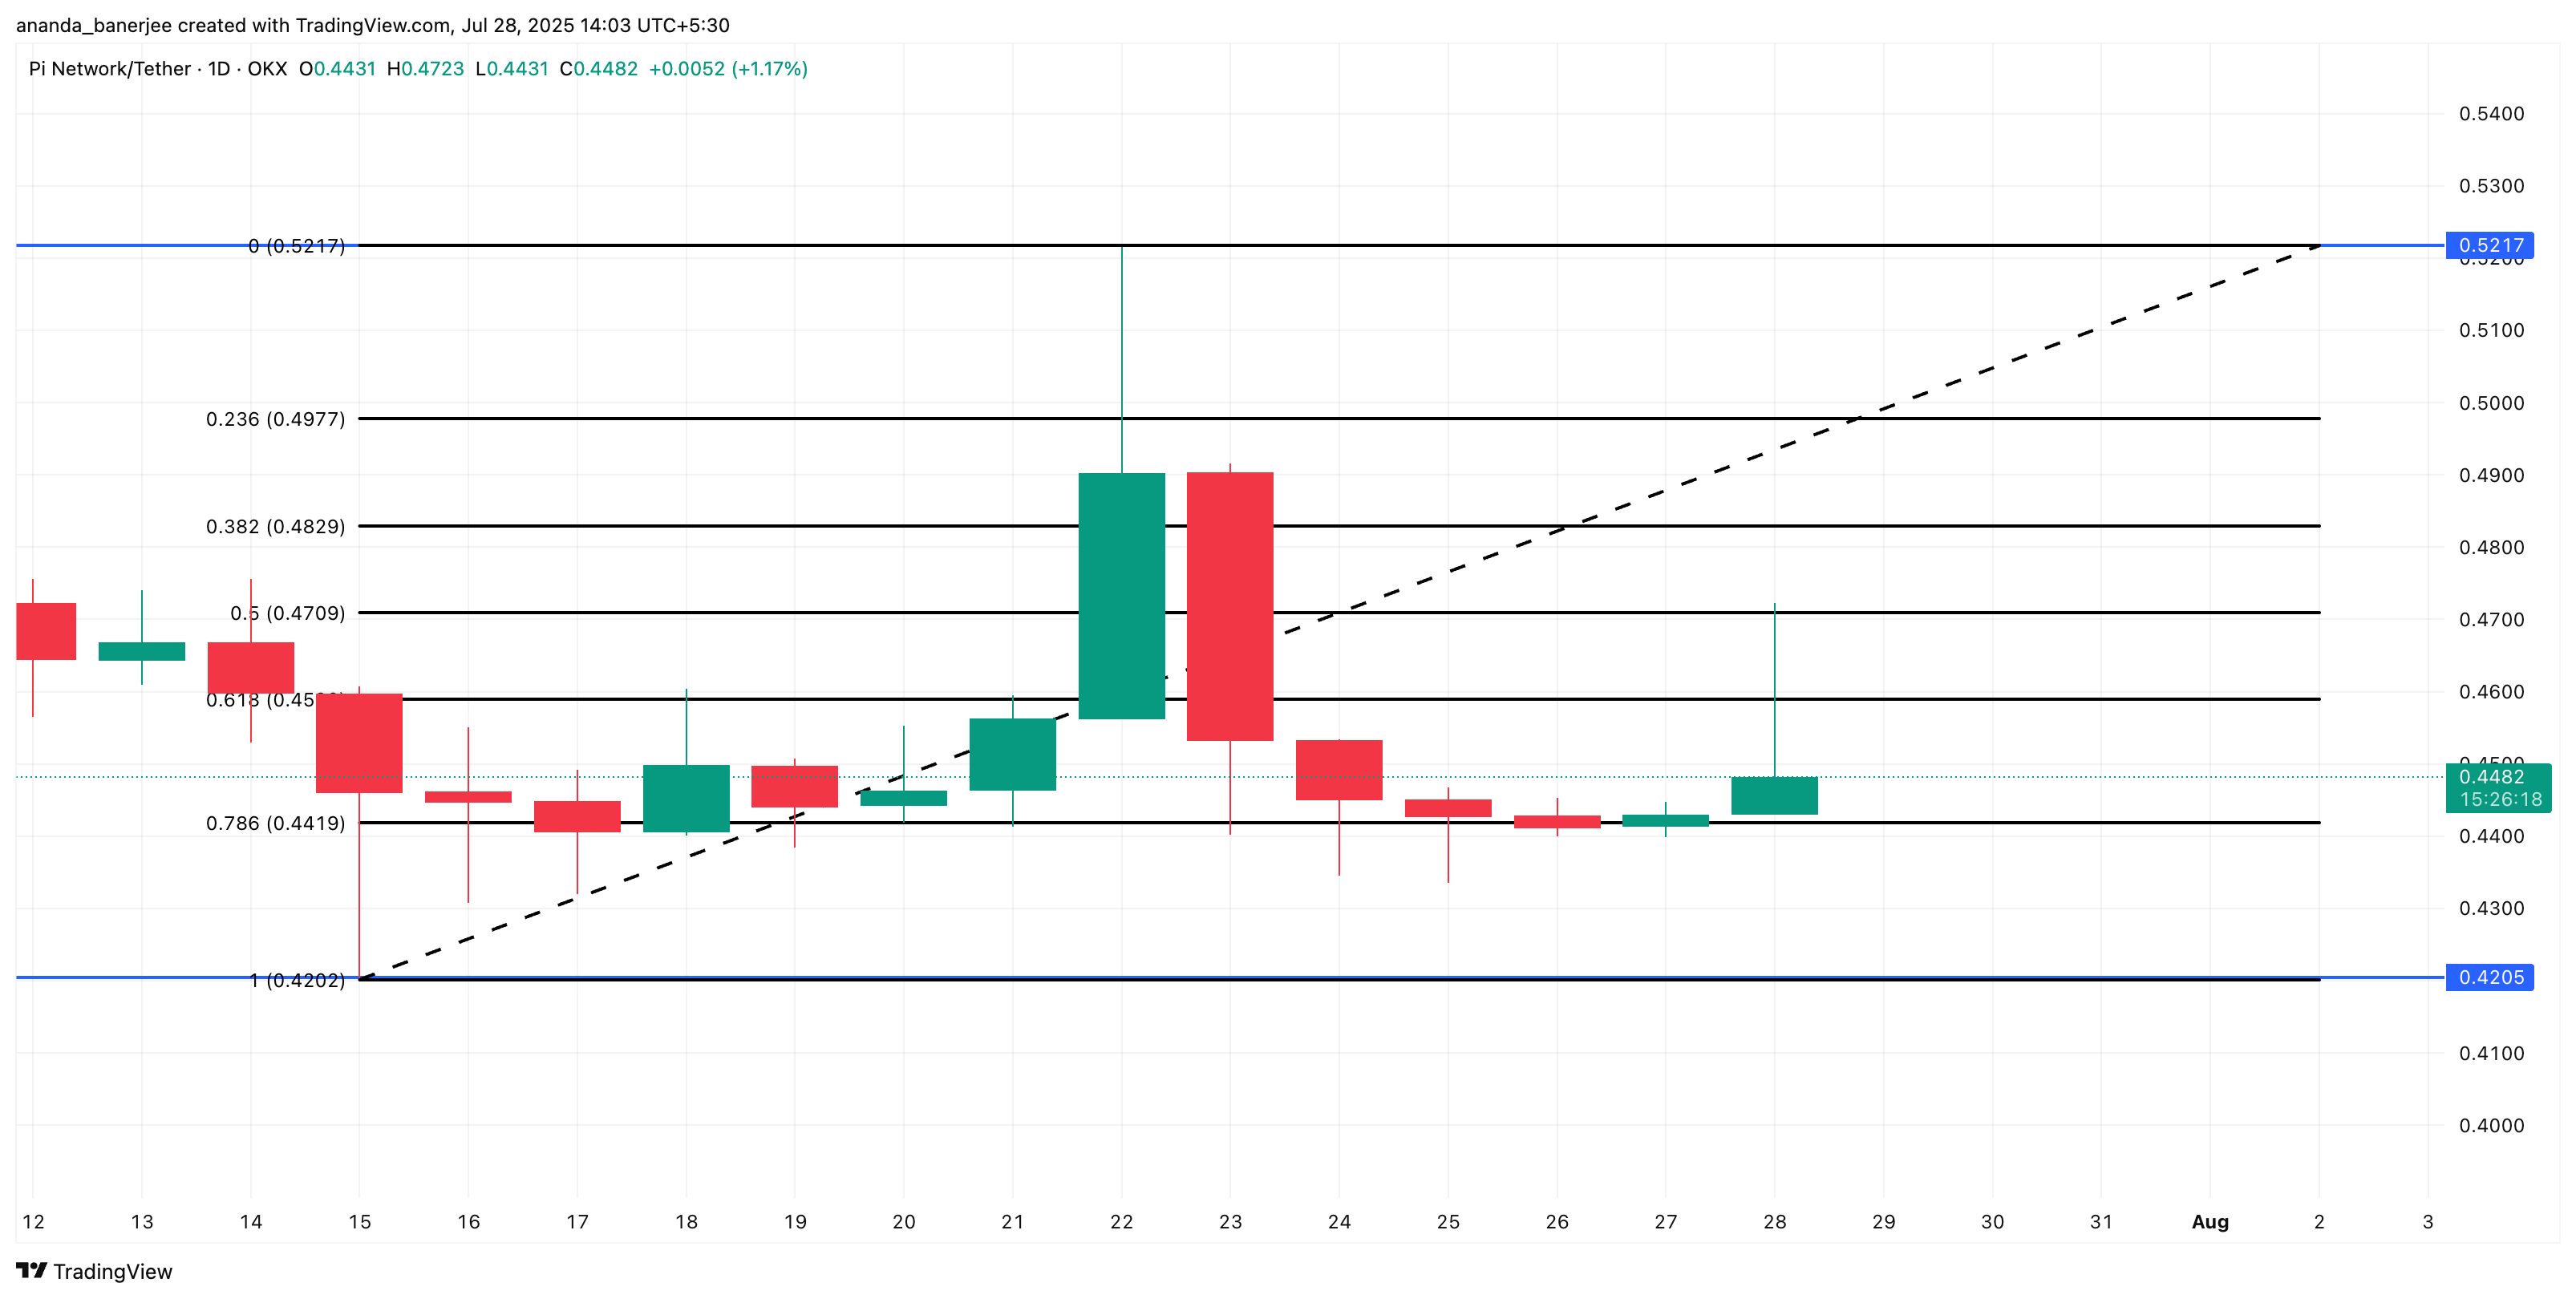 PI price analysis:
On the flip side, a close below $0.44, the 0.786 Fib extension, would invalidate this bullish structure. Until then, traders might want to stay alert for confirmation before positioning too aggressively.
Disclaimer: The content of this article solely reflects the author's opinion and does not represent the platform in any capacity. This article is not intended to serve as a reference for making investment decisions.
You may also like
Top Meme Coins to Buy Today 5 Picks Targeting +200% Market Moves

SHIB Breakout Targets $0.0000165 First and $0.0001 on Extended Rally

PEPE Symmetrical Triangle Targets $0.00001811 and $0.000026 Levels

Best 5 Altcoins Showing Early Strength — Why Holding Now Could Deliver Better Returns