Date: Sat, Aug 02, 2025 | 06:04 PM GMT
The broader crypto market has entered a phase of sharp correction, led by Ethereum (ETH) retreating from the $3,940 resistance level to around $3,425 — a significant daily drop that has sent ripples across altcoins . Jasmycoin (JASMY) hasn’t been spared, sliding 18% this week and paring back its monthly gains to just 11%.
But despite the recent decline, JASMY’s current price behavior is starting to look familiar — and in a good way. Price action is echoing a prior fractal pattern that preceded a major bullish rally, raising hopes among traders that history might be about to repeat itself.
 Source: Coinmarketcap
Fractal Setup Hints at a Bullish Reversal
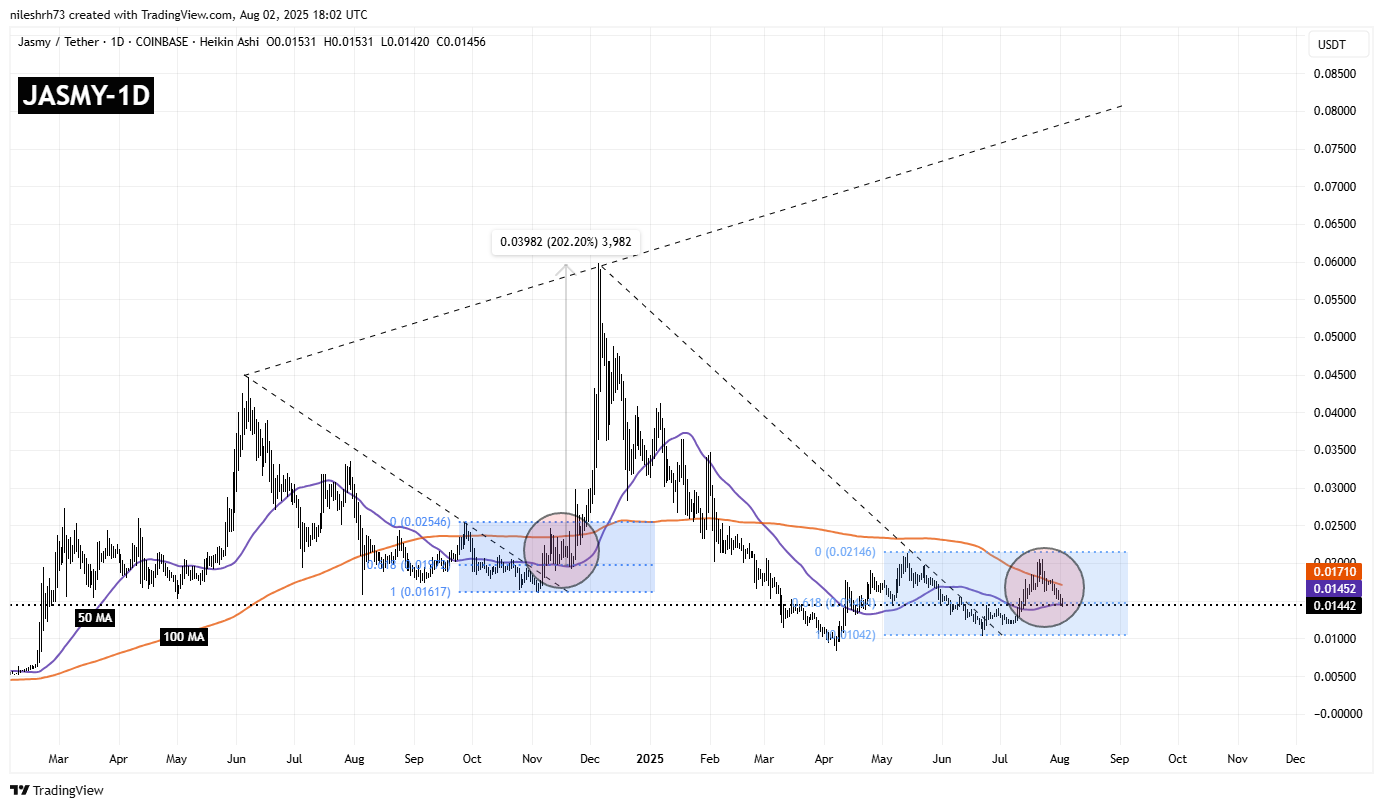
On the daily chart, JASMY is beginning to mimic a structure seen back in October 2024.
At that time, the token broke out of a long-standing downtrend, reclaimed both its 50-day and 200-day moving averages (MA), then underwent a sharp correction. That pullback found strong support at the 50-day MA and the 0.618 Fibonacci retracement level — a critical confluence zone that acted as a launchpad for a 202% rally toward the ascending resistance trendline.
 Jasmycoin (JASMY) Fractal Chart//Coinsprobe (Source: Tradingview)
Fast forward to the present — and a near-identical pattern appears to be unfolding.
JASMY has again broken above a downtrend, reclaimed the 50-day and 200-day MAs, and is now in the midst of a similar correction. It is currently testing the same key confluence zone: the 50-day MA and the 0.618 Fib level, both of which were pivotal last time in sparking a reversal.
What’s Next for JASMY?
If the fractal setup plays out as it did before, JASMY could bounce strongly from this support area. A successful move above the 200-day MA, which currently sits near $0.01710, would confirm bullish momentum and potentially ignite a rally toward the upper resistance line, projected above the $0.080 level.
However, to maintain this bullish outlook, JASMY must reclaim and hold above the 200-day MA. Failing to do so could invalidate the fractal and expose the price to deeper losses.


