XRP Price Prediction For August 5
XRP has shown some bullish action in the short term, climbing back above key support levels. However, a closer look at long-term technical indicators reveals that this rally may be temporary. According to recent analysis, XRP could be entering a period of correction that may last several weeks or even months.
Bearish Divergence on the Weekly Chart
One of the strongest warning signals comes from the weekly time frame. Analysts have confirmed a bearish divergence on the XRP chart. This happens when the price makes higher highs, but the Relative Strength Index (RSI) makes lower highs.
The last time such a pattern appeared was between late 2020 and early 2021. That divergence led to a 60% drop in XRP’s price over a span of about three months. While the price did bounce during that period, the overall trend remained negative for a while.
What History Tells Us
The previous bearish divergence saw XRP experience short-term recoveries, but those were followed by deeper pullbacks. From April to July 2021, for example, XRP dropped sharply despite a brief 70% bounce in between.
This tells us that while short-term gains are possible, larger bearish trends often dominate, especially when they are supported by strong technical signals like the current divergence on the weekly chart.
Current Market Behavior
Right now, XRP is trading around $3.05 after a strong recovery from recent lows. The coin has managed to break back above the $2.90 support zone, which could now act as a short-term support area between $2.90 and $3.00. The resistance levels are around $3.10–$3.20, and possibly even $3.40.
The current price pattern looks very similar to what XRP showed at the start of 2025. Back then, XRP surged, held a key level for some time, then broke below support and entered a prolonged downtrend. Even though there were some strong recoveries, the overall direction remained negative for months.
This is raising concerns that XRP might be repeating that same cycle now, especially with the bearish divergence already confirmed on the weekly chart.
Disclaimer: The content of this article solely reflects the author's opinion and does not represent the platform in any capacity. This article is not intended to serve as a reference for making investment decisions.
You may also like
DiDi has become a digital banking giant in Latin America
DiDi has successfully transformed into a digital banking giant in Latin America by addressing the lack of local financial infrastructure, building an independent payment and credit system, and achieving a leap from a ride-hailing platform to a financial powerhouse. Summary generated by Mars AI. This summary was produced by the Mars AI model, and its accuracy and completeness are still being iteratively improved.

Fed rate cuts in conflict, but Bitcoin's "fragile zone" keeps BTC below $100,000
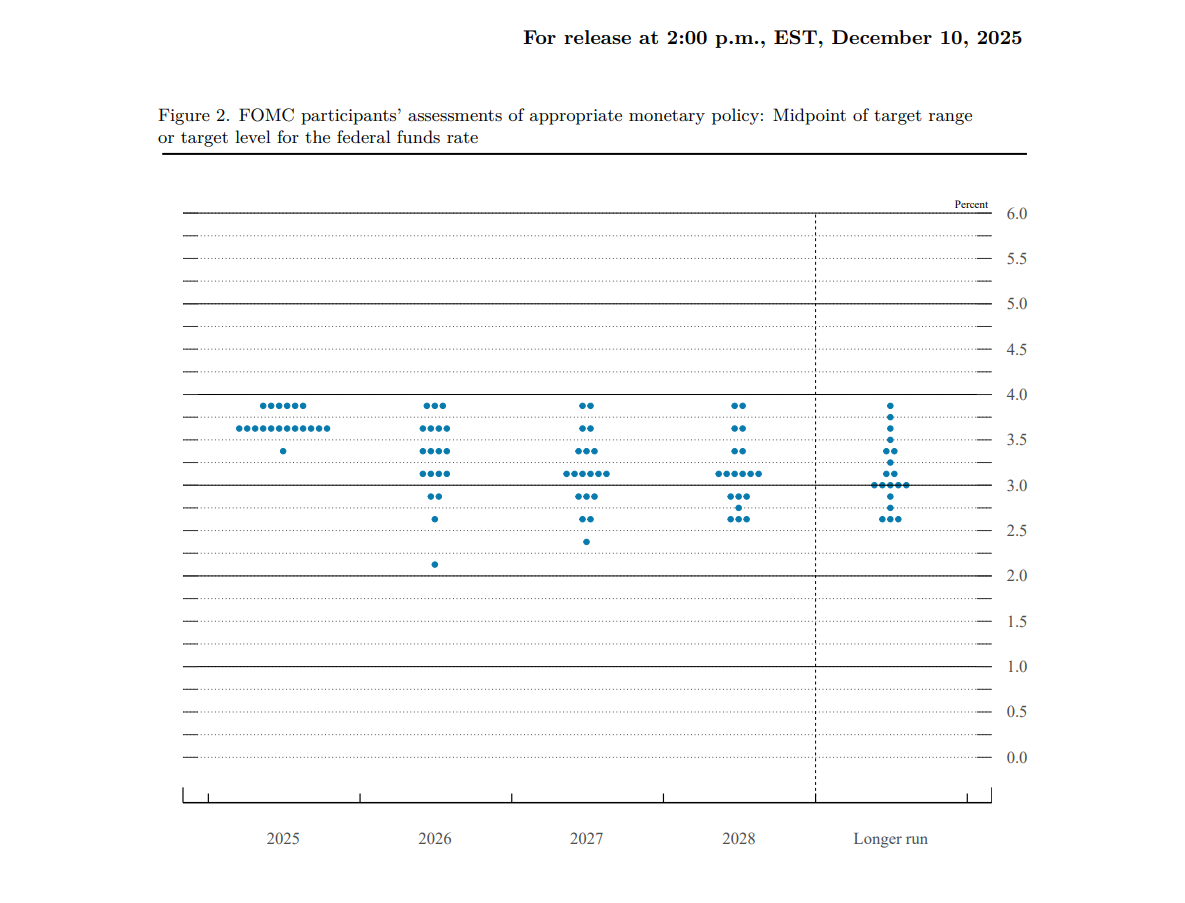
The Federal Reserve cut interest rates by 25 basis points, but the market interpreted the move as hawkish. Bitcoin is constrained by a structurally fragile range, making it difficult for the price to break through $100,000. Summary generated by Mars AI This summary was generated by the Mars AI model, and the accuracy and completeness of its content are still being iteratively updated.

Full text of the Federal Reserve decision: 25 basis point rate cut, purchase of $4 billion in Treasury bills within 30 days
The Federal Reserve cut interest rates by 25 basis points with a 9-3 vote. Two members supported keeping rates unchanged, while one supported a 50 basis point cut. In addition, the Federal Reserve has restarted bond purchases and will buy $40 billion in Treasury bills within 30 days to maintain adequate reserve supply.

HyENA officially launched: Perp DEX supported by Ethena and based on USDe collateral goes live on Hyperliquid
The launch of HyENA further expands the USDe ecosystem and brings institutional-grade margin efficiency to the on-chain perpetuals market.
