Bitcoin Price Regains Strength – Can the Rebound Turn Explosive?

Bitcoin price is recovering from the $112,000 support zone. BTC is rising and might attempt to clear the $115,500 resistance zone to gain bullish momentum.
- Bitcoin started a decent upward move from the $112,000 zone.
- The price is trading above $114,000 and the 100 hourly Simple moving average.
- There is a bullish trend line forming with support at $114,600 on the hourly chart of the BTC/USD pair (data feed from Kraken).
- The pair might start another increase if it clears the $115,500 resistance zone.
Bitcoin Price Eyes Upside Break
Bitcoin price started a downward move from the $118,000 zone. BTC declined below the $115,000 and $113,500 support levels to enter a short-term bearish zone.
The price tested the $112,000 zone. A base was formed and the price is now attempting to recover. There was a move above the $113,500 and $114,200 levels. The price surpassed the 23.6% Fib retracement level of the downward move from the $118,918 swing high to the $112,000 low.
Bitcoin is now trading above $114,200 and the 100 hourly Simple moving average. There is also a bullish trend line forming with support at $114,600 on the hourly chart of the BTC/USD pair.
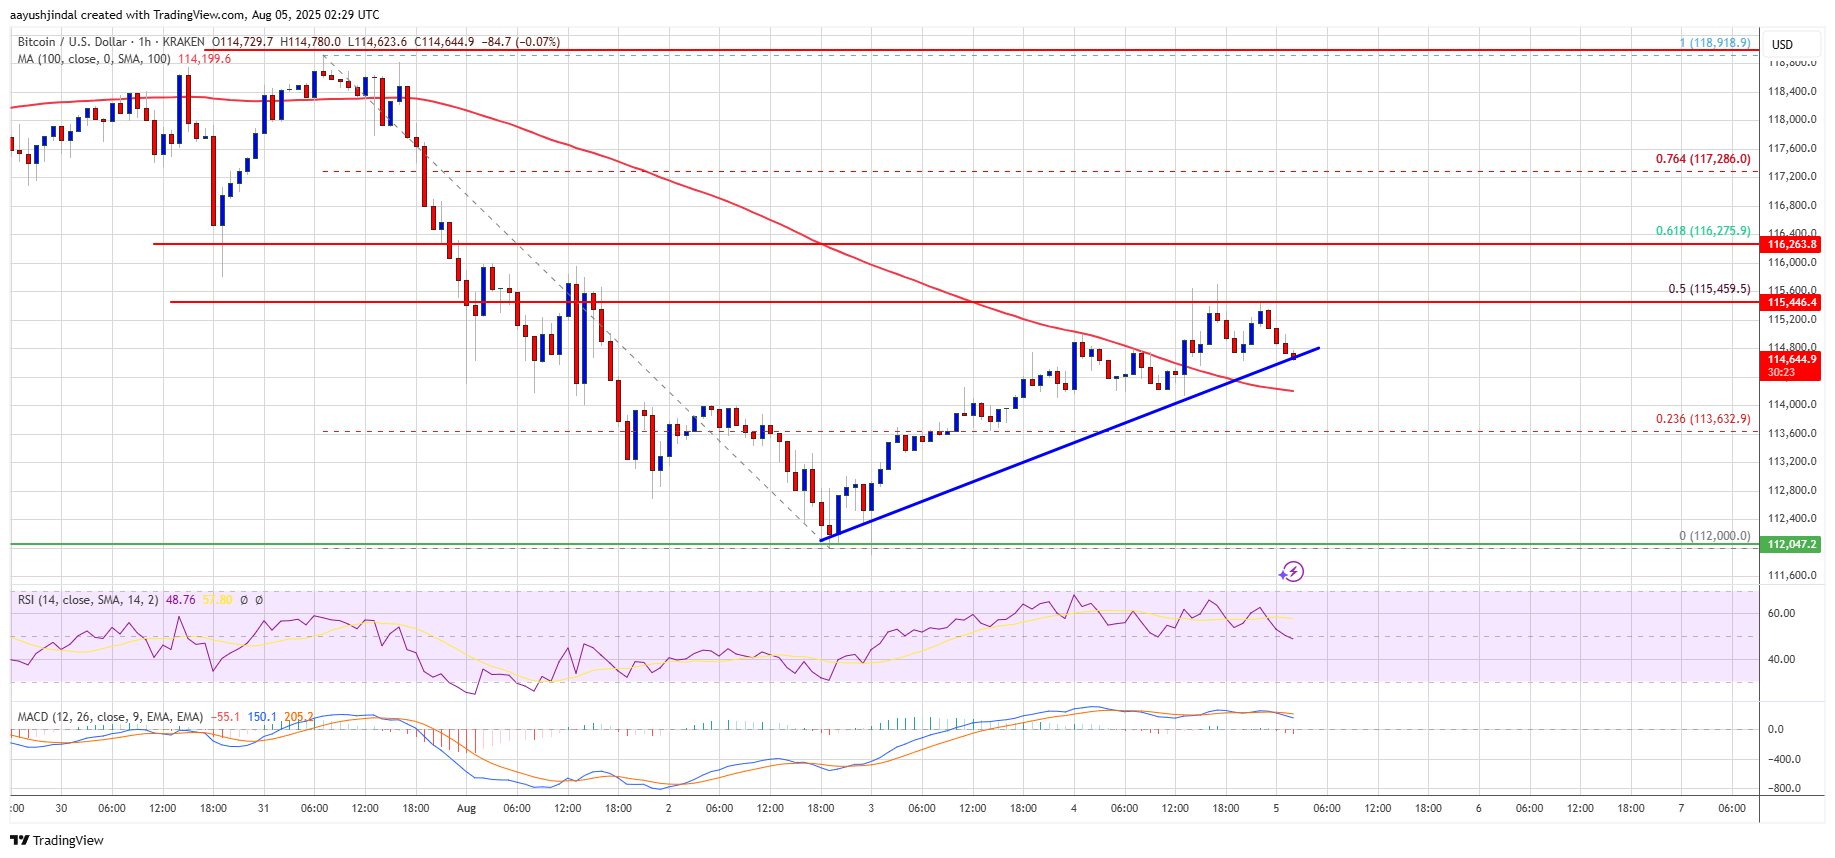
Immediate resistance on the upside is near the $115,500 level. It is close to the 50% Fib retracement level of the downward move from the $118,918 swing high to the $112,000 low. The first key resistance is near the $116,250 level. The next resistance could be $116,800. A close above the $116,800 resistance might send the price further higher. In the stated case, the price could rise and test the $118,500 resistance level. Any more gains might send the price toward the $120,500 level. The main target could be $121,200.
Another Decline In BTC?
If Bitcoin fails to rise above the $115,500 resistance zone, it could start another decline. Immediate support is near the $114,600 level. The first major support is near the $113,500 level.
The next support is now near the $112,000 zone. Any more losses might send the price toward the $110,500 support in the near term. The main support sits at $108,500, below which BTC might continue to move down.
Technical indicators:
Hourly MACD – The MACD is now gaining pace in the bullish zone.
Hourly RSI (Relative Strength Index) – The RSI for BTC/USD is now above the 50 level.
Major Support Levels – $114,600, followed by $113,500.
Major Resistance Levels – $115,500 and $116,800.
Disclaimer: The content of this article solely reflects the author's opinion and does not represent the platform in any capacity. This article is not intended to serve as a reference for making investment decisions.
You may also like
Five charts to help you understand: Where does the market go after each policy storm?
After this regulatory crackdown, is it a harbinger of an impending downturn, or the beginning of a new cycle where all negative news has been fully priced in? Let’s examine the trajectory after the storm through five key policy milestones.

Mars Morning News | The crypto market rebounds across the board, Bitcoin rises above $94,500; The "CLARITY Act" draft is expected to be released this week
The crypto market has fully rebounded, with bitcoin surpassing $94,500 and US crypto-related stocks rising across the board. The US Congress is advancing the CLARITY Act to regulate cryptocurrencies. The SEC chairman stated that many ICOs are not securities transactions. Whales are holding a large number of profitable ETH long positions. Summary generated by Mars AI. The accuracy and completeness of the content generated by the Mars AI model is still being iteratively updated.

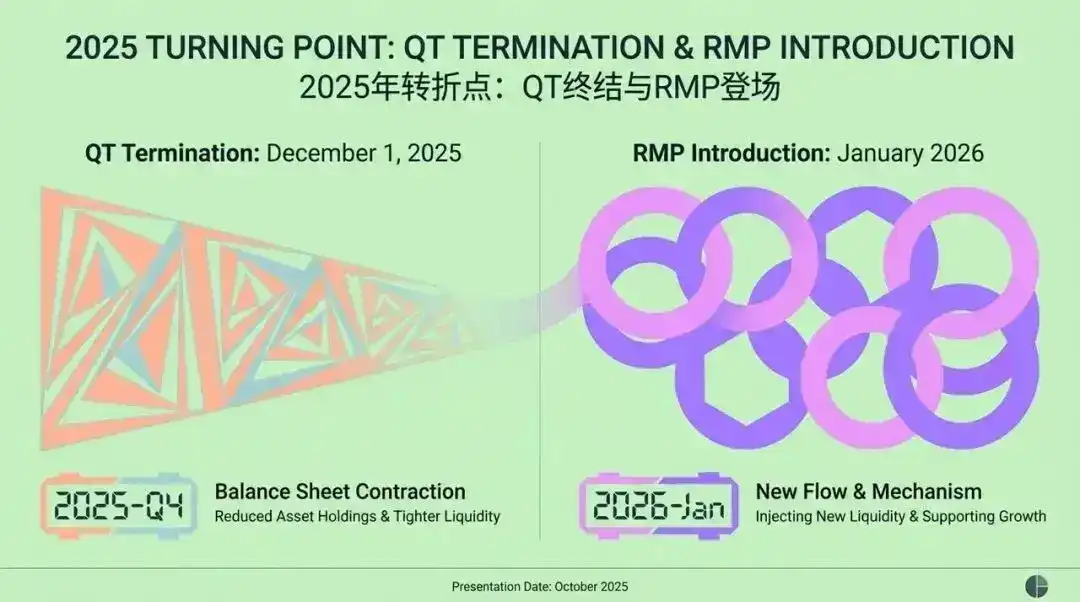
Federal Reserve’s Major Shift: From QT to RMP, How Will the Market Transform by 2026?
The article discusses the background, mechanism, and impact on financial markets of the Federal Reserve's introduction of the Reserve Management Purchases (RMP) strategy after ending Quantitative Tightening (QT) in 2025. RMP is regarded as a technical operation aimed at maintaining liquidity in the financial system, but the market interprets it as a covert easing policy. The article analyzes RMP's potential effects on risk assets, the regulatory framework, and fiscal policy, and provides strategic recommendations for institutional investors. Summary generated by Mars AI This summary was generated by the Mars AI model, and the accuracy and completeness of its content are still in the process of iterative improvement.
Rate Hike in Japan: Will Bitcoin Resist Better Than Expected?