Pi Coin Price Makes 2 Bullish Moves in August: Do Buyers Still Want a Slice of PI?

Pi Coin has been in freefall, but two short-term chart signals now suggest a potential trend shift. From EMA crossovers to bull-bear strength, here’s what’s changing under the surfac
July was rough for Pi Coin. But why stop there? Over the past year, the token has shed over 60% of its value. Traders have largely tuned out. Yet in the first week of August, something changed.
PI bounced 4.6% from its all-time low, and for the first time since July 30, two short-term bullish moves have surfaced, hinting at a potential shift in sentiment.
Bulls Show Signs of Life First Time In August
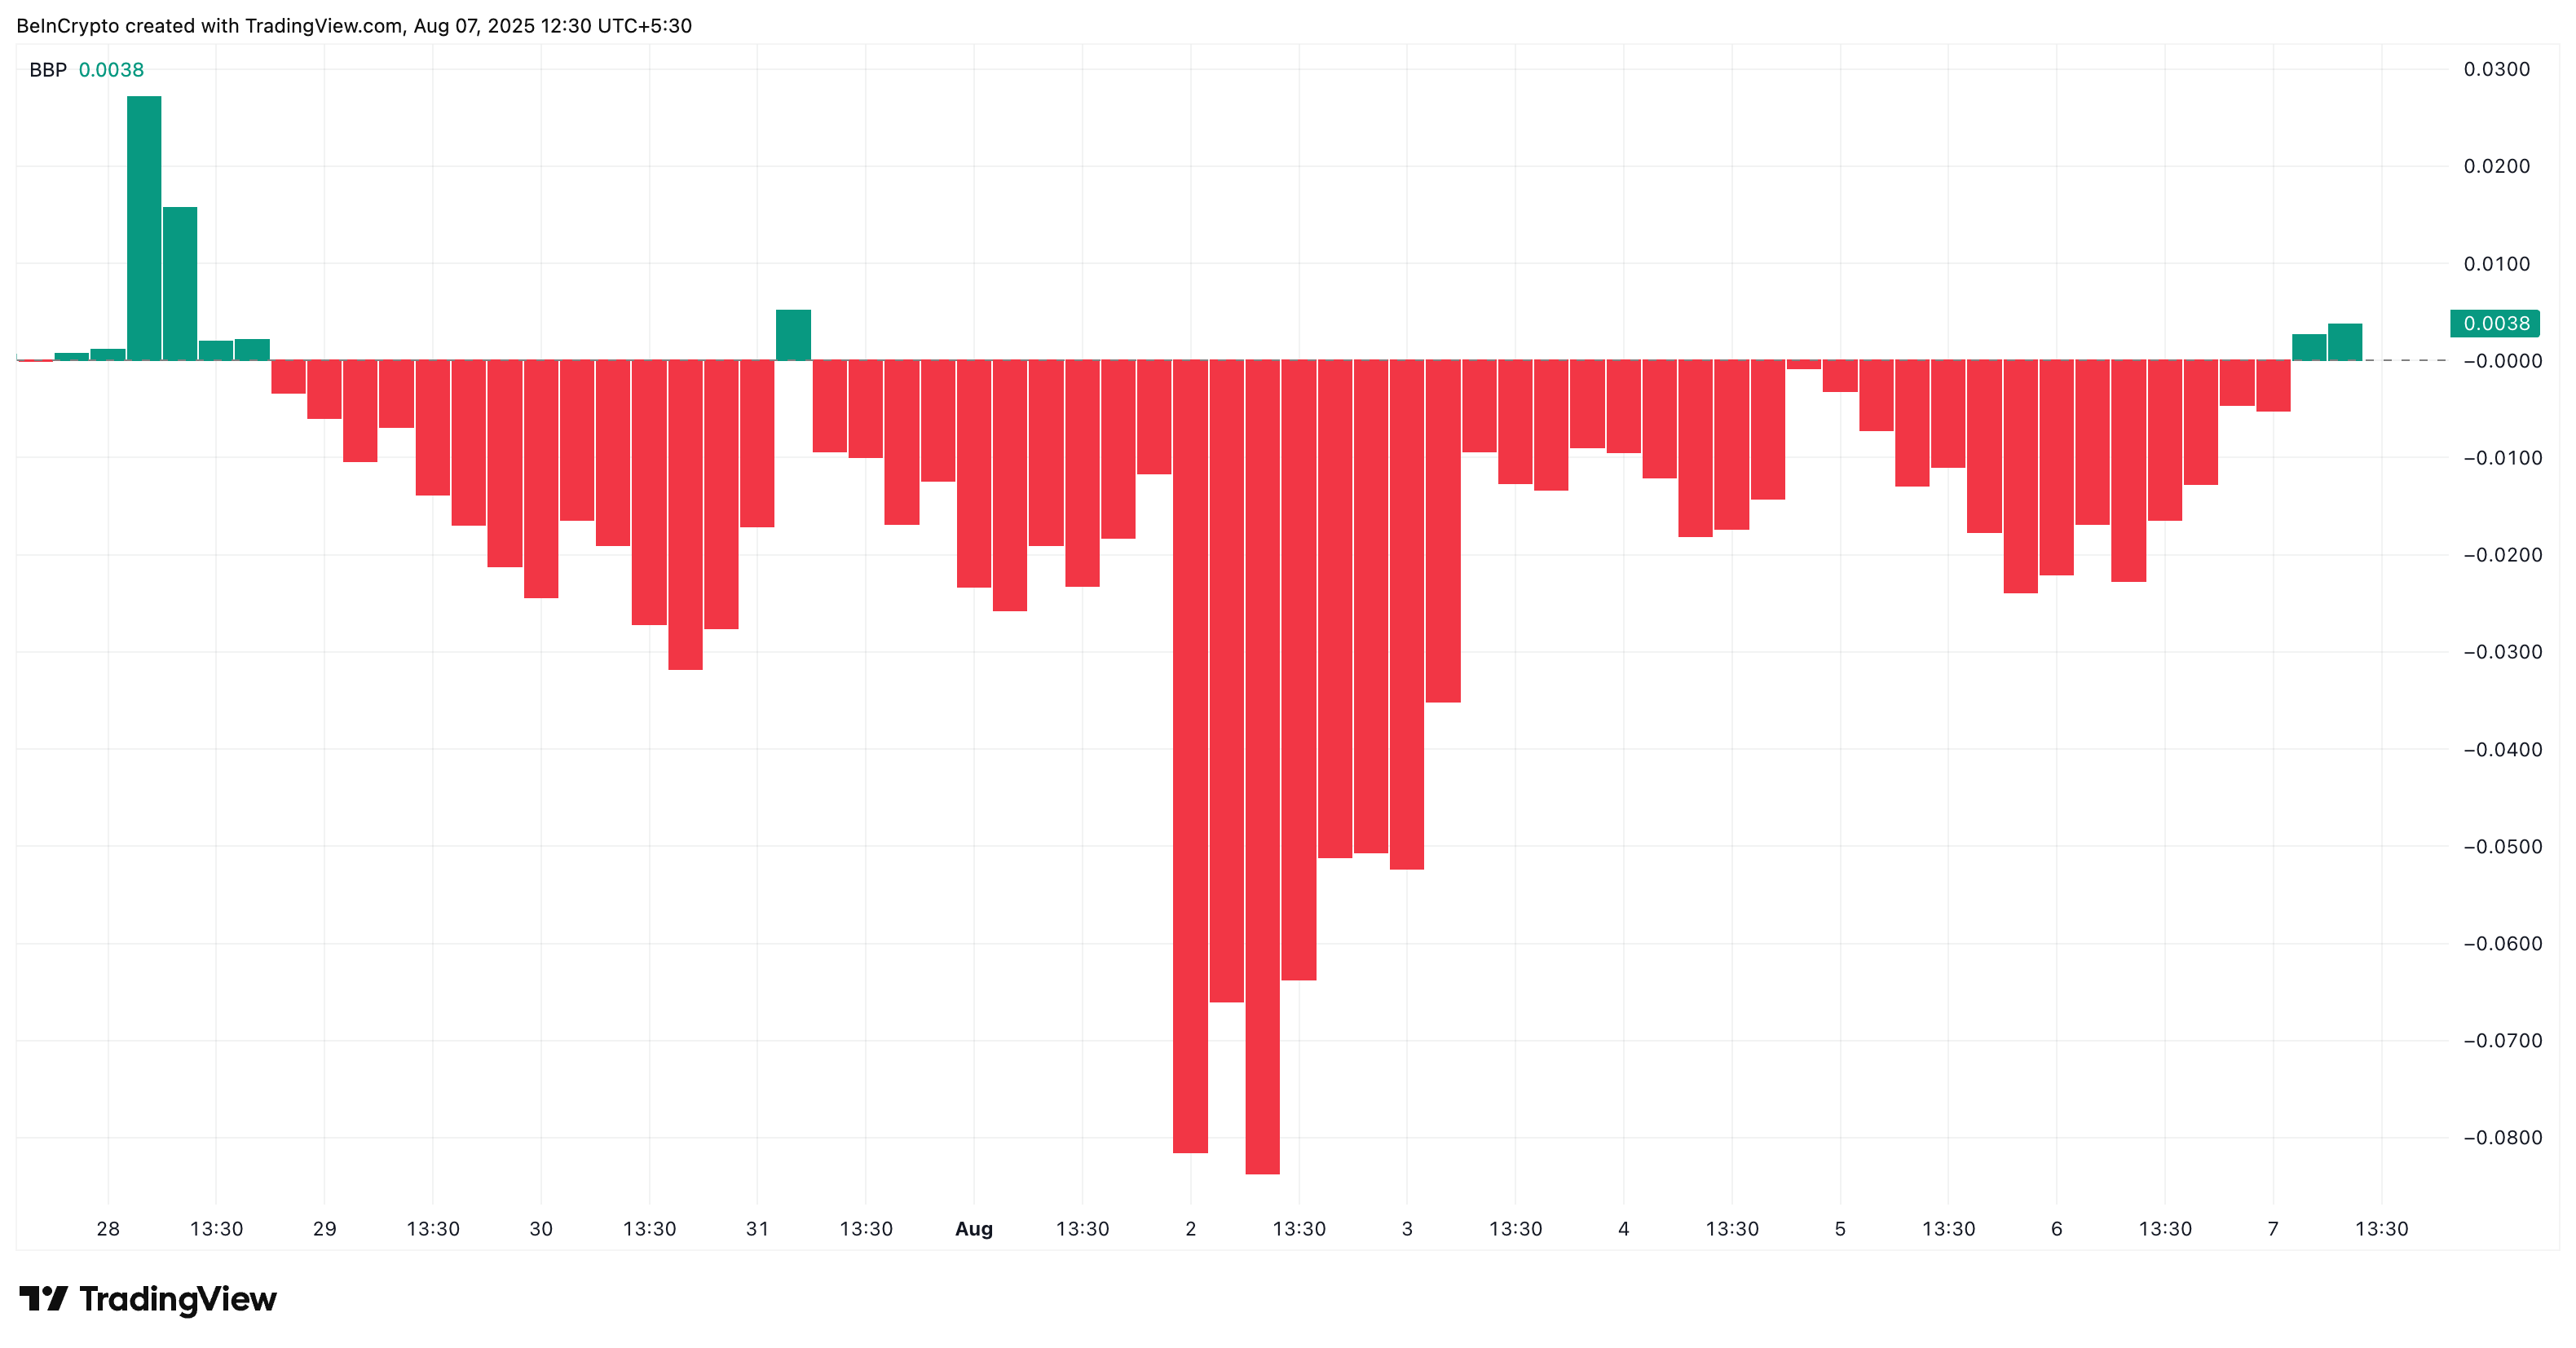
The first notable signal came on the 4-hour bull-bear power chart, where a green bar flashed after 40+ sessions. This matters. The last time bulls registered on this chart was back in July, and since then, sellers have completely dominated. A green bar suggests that for the first time in weeks, buying pressure has overtaken selling power, even if briefly.
 Pi Network bulls come back to life:
The Bull-Bear Power index tracks the difference between intraday highs and lows relative to a moving average. When green bars appear, it indicates bulls are attempting to take control, often a subtle but early sign of accumulation.
2-Hour Chart Reveals PI Coin Trend Shift With EMA Crossover
While the 4-hour chart showed the first signs of buying pressure, it lacked directional clarity. That’s why we shift to the 2-hour chart: to catch early trend changes and momentum buildups that larger timeframes might blur.
 PI Coin Price 2-hour chart:
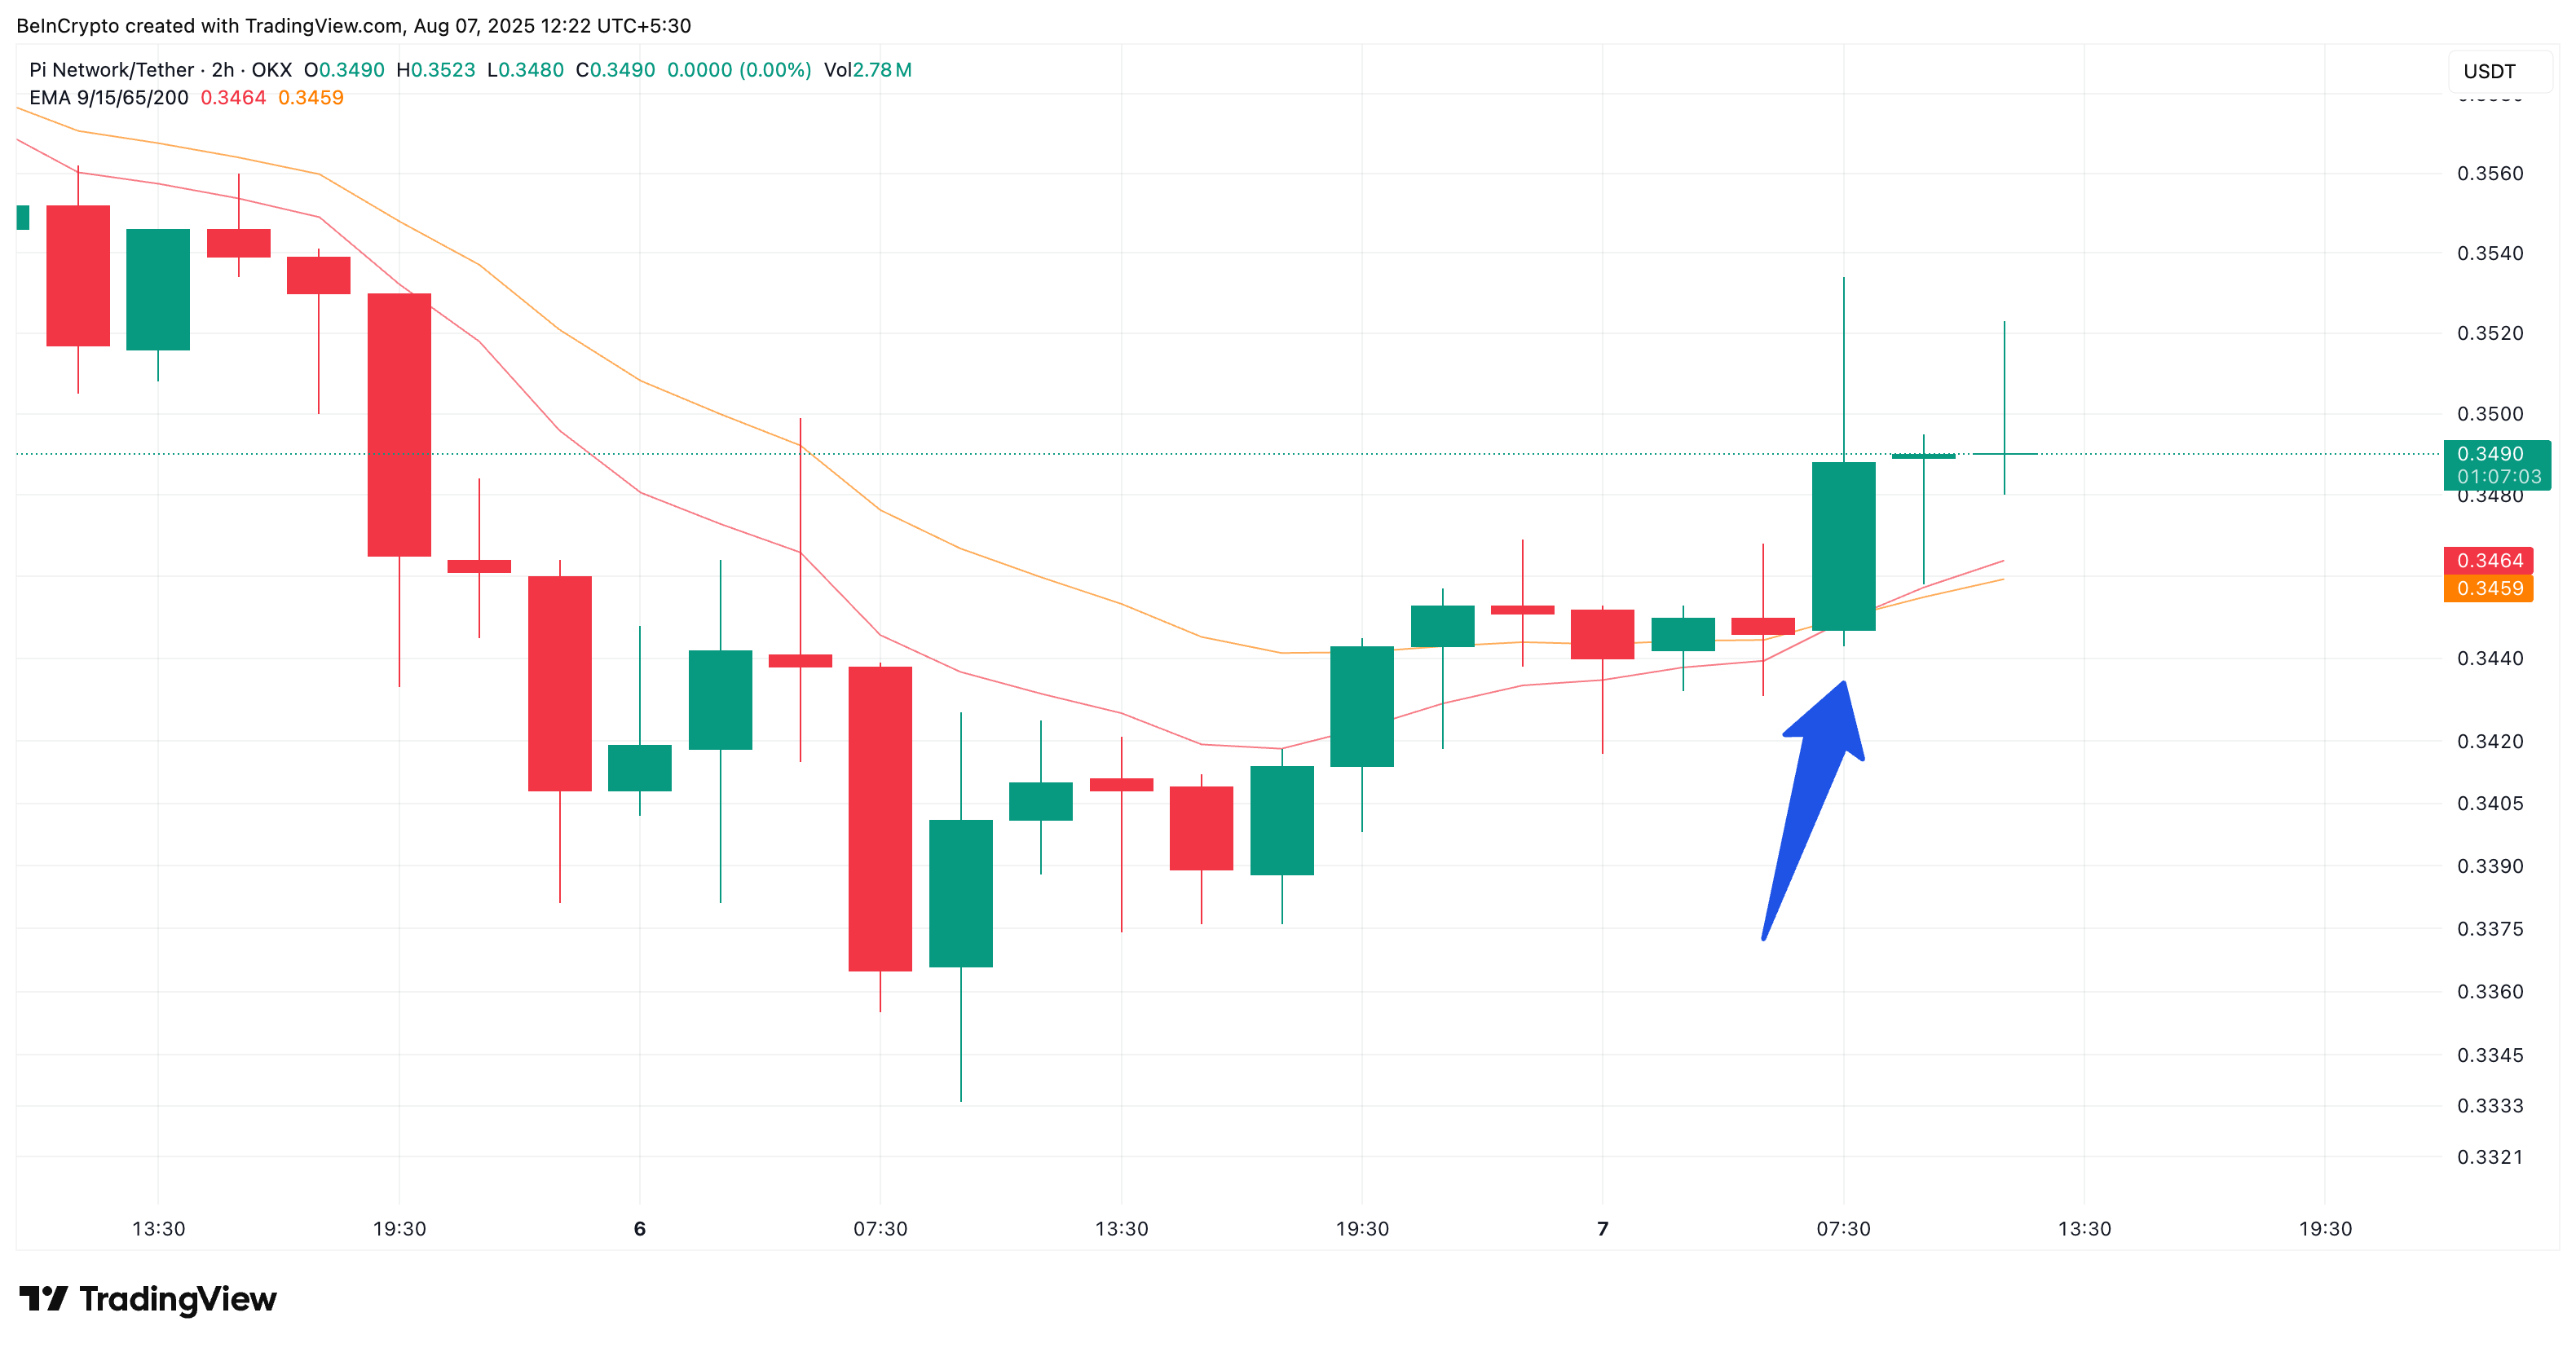
On this lower timeframe, a 9/15-period exponential moving average (EMA) crossover has just taken place, with the faster-moving 9-EMA (red line) crossing above the slower 15-EMA (orange line). This suggests that buyers have started gaining control over short-term price action, overpowering sellers for the first time in August. The 9/15 EMA is often used to identify early momentum shifts before they appear on higher timeframes, making this crossover a relevant bullish cue.
Compared to the more commonly used 20/50-period EMAs, the 9/15 crossover reacts faster to smaller price shifts, making it more effective for spotting momentum shifts before they become obvious on longer timeframes. However, while it gives earlier signals, it’s also more sensitive to noise, so confirmation from price structure and volume remains essential.
PI Coin Price: All About A Pennant Pattern and Key Breakout Levels
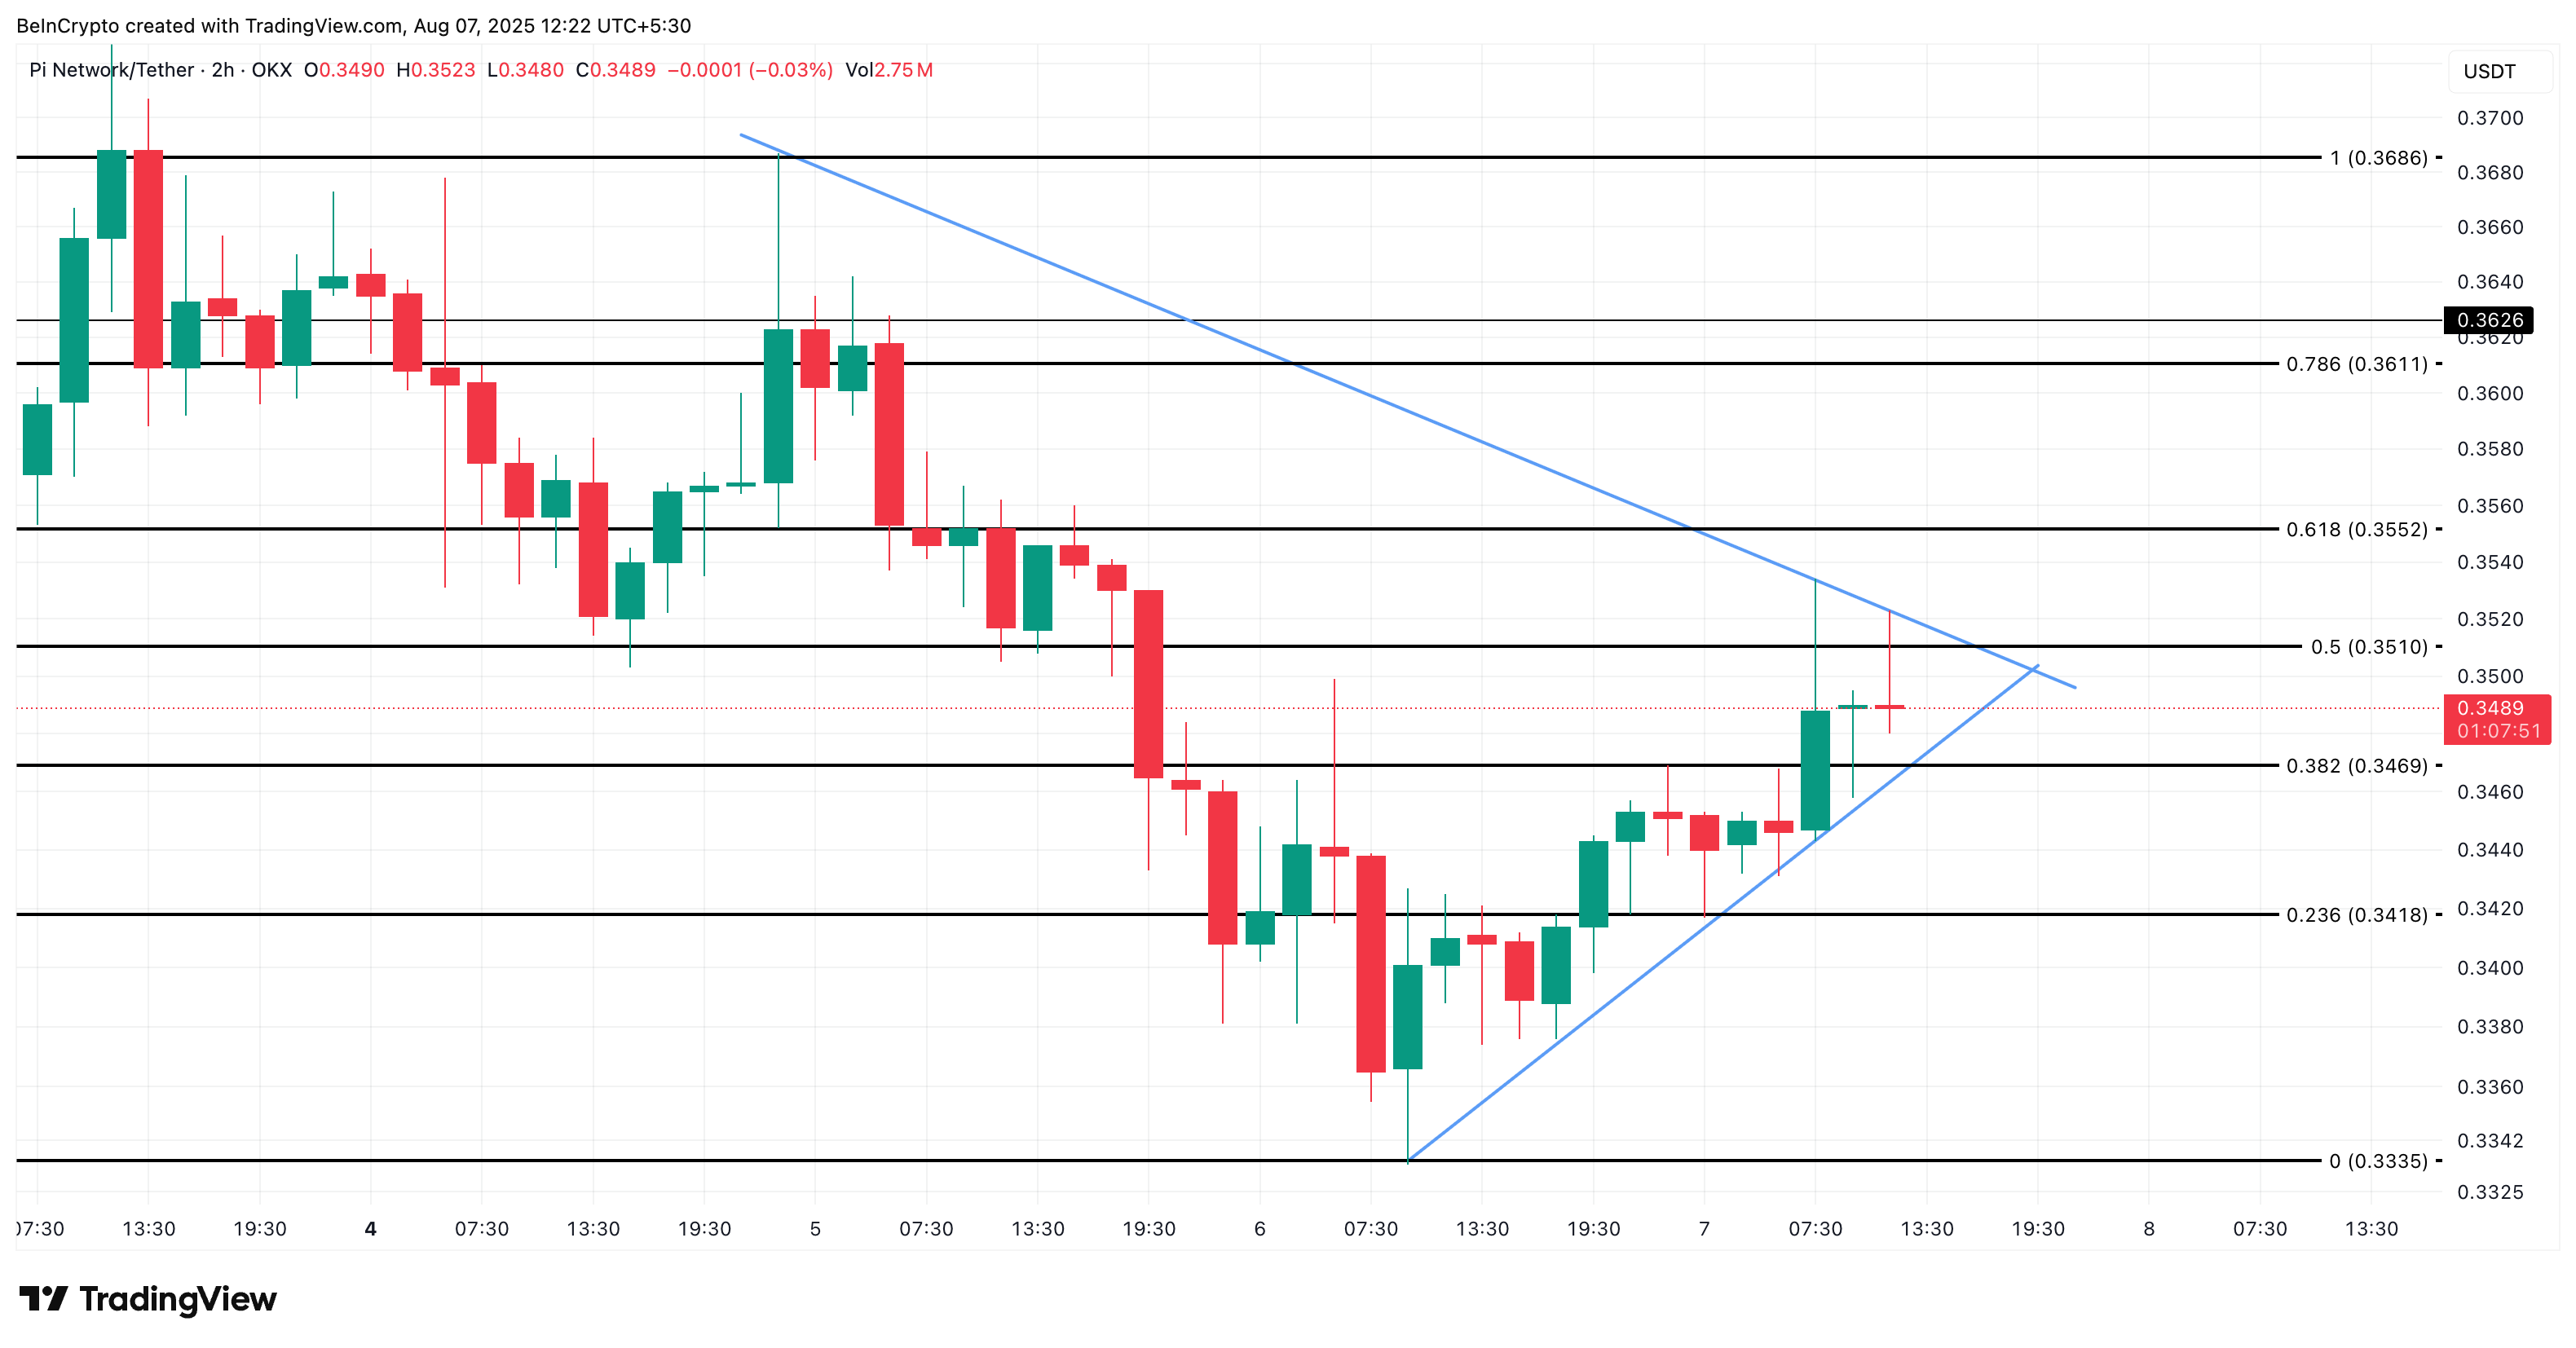
On the same 2-hour chart, the PI price is also pressing against the upper trendline of a bullish pennant, consolidating tightly near $0.35. A clean candle close above that level could unlock a short leg higher, with short-term targets near $0.36.
 Pi Coin short-term price action:
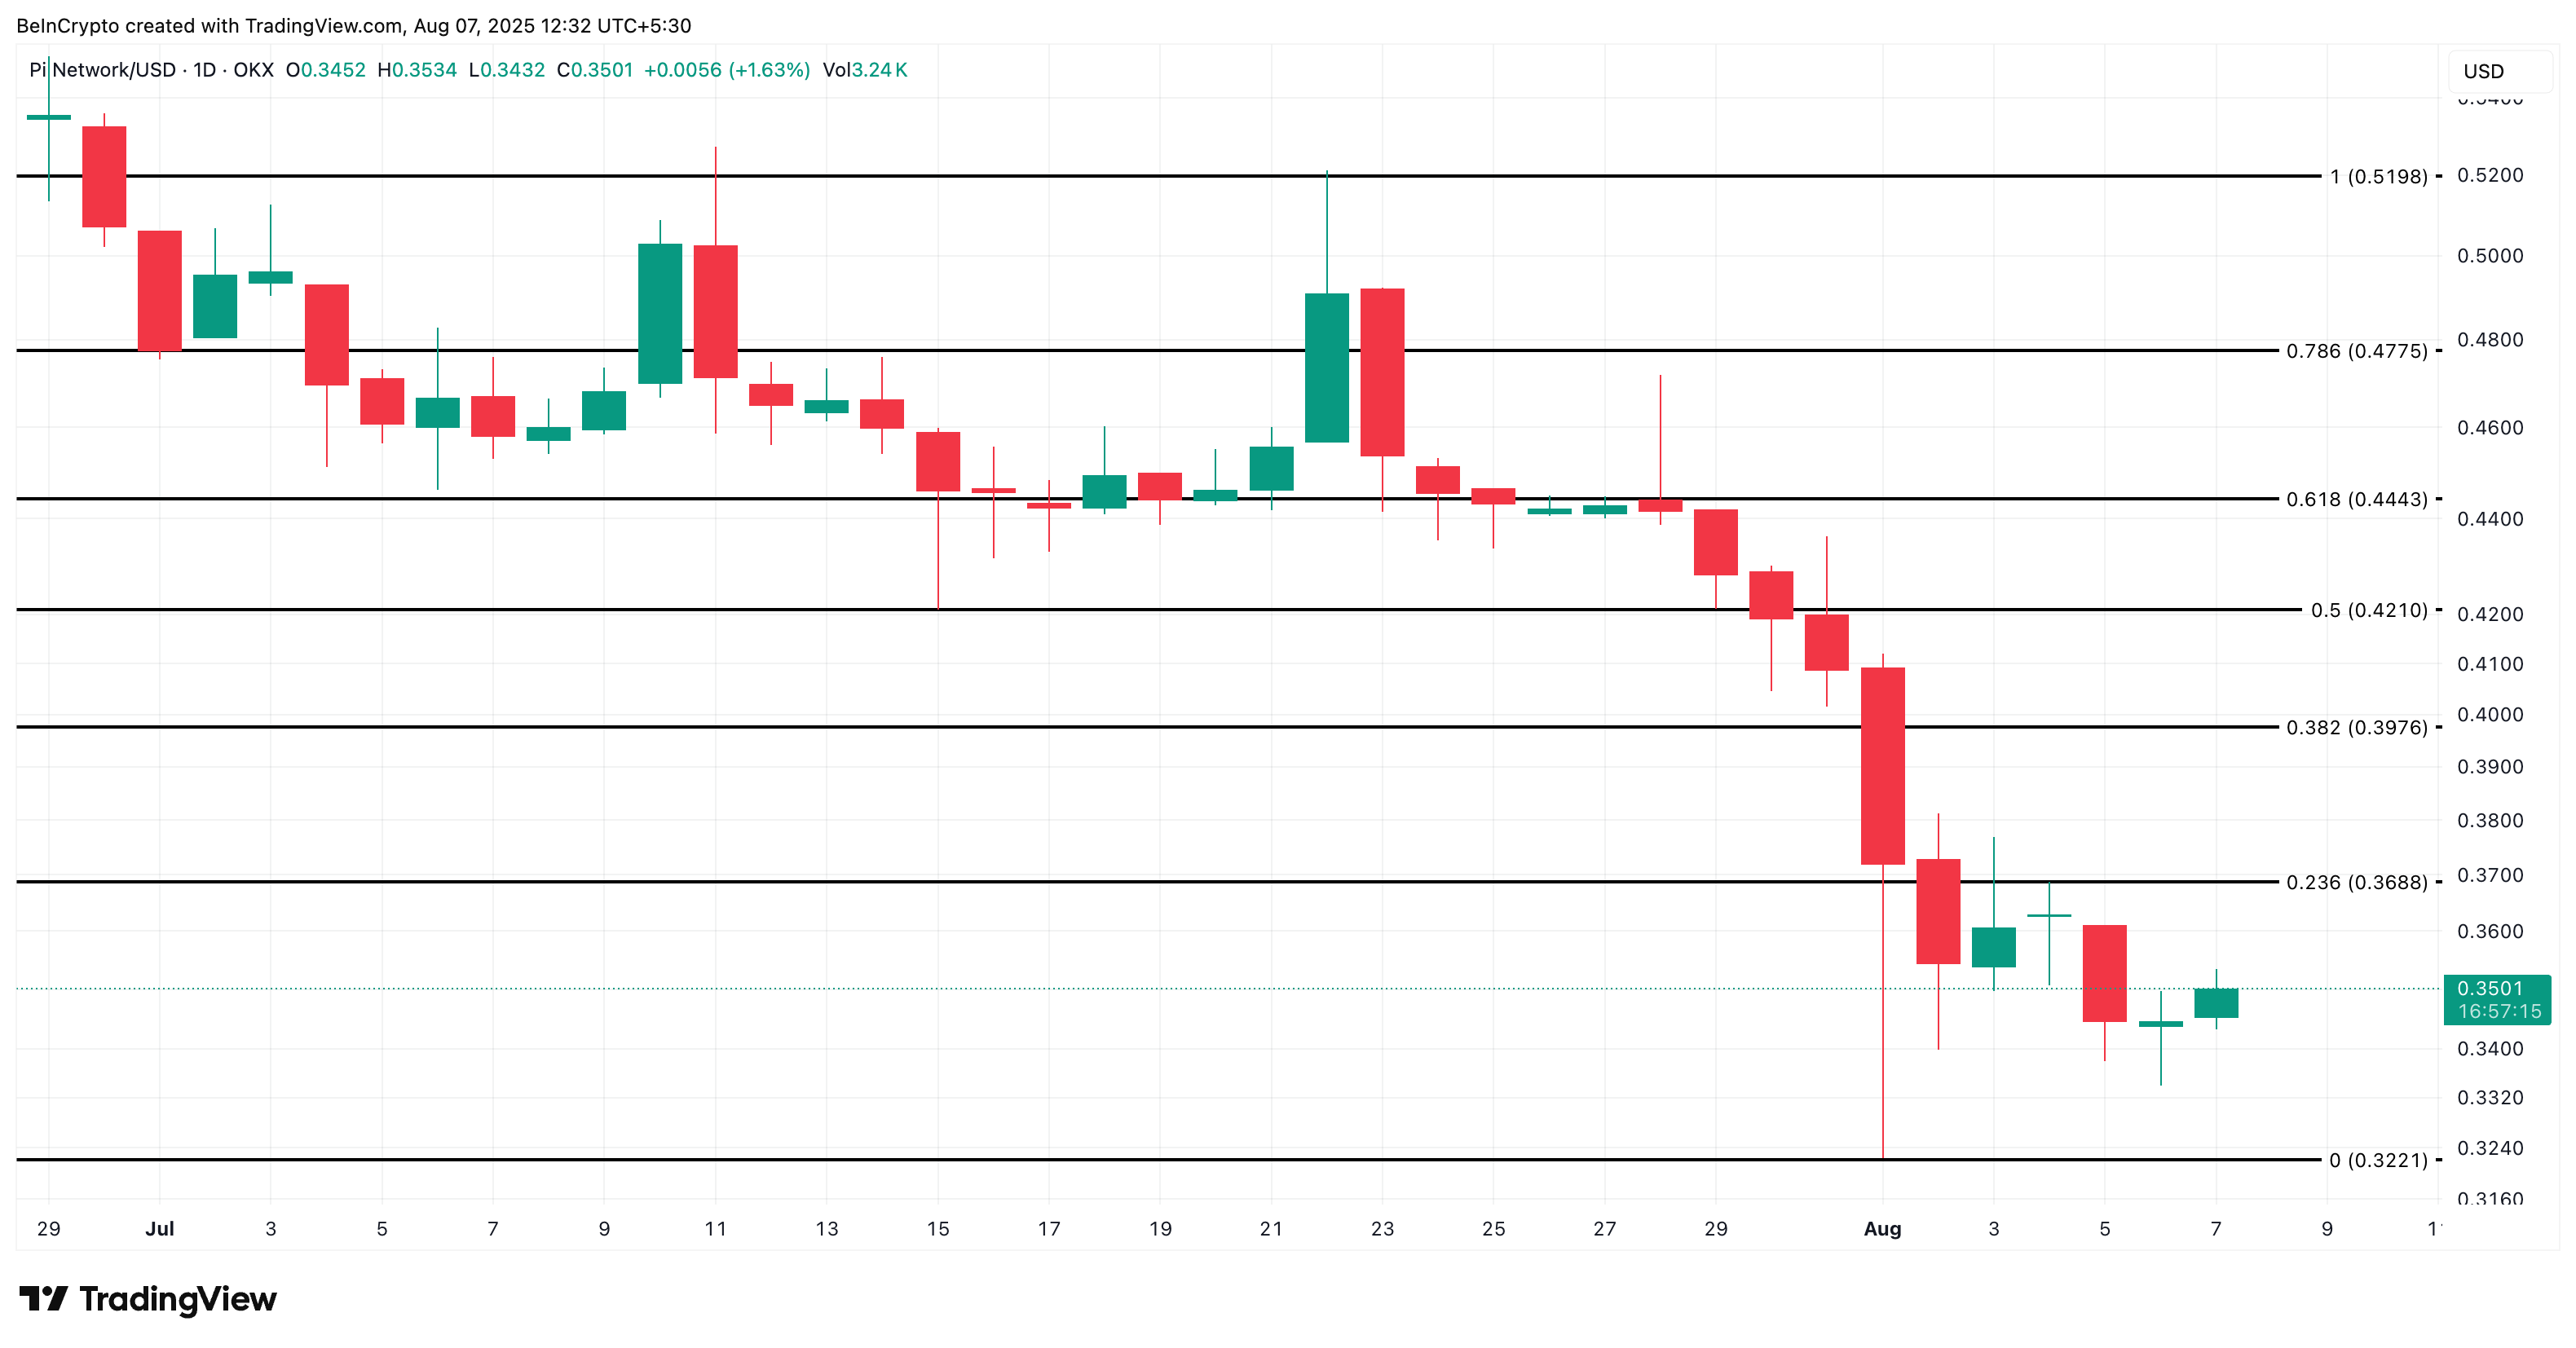
The daily Pi Coin price chart confirms that these levels are key resistance zones. The 0.36 mark aligns with the upper boundary of previous rejections, followed by $0.39.
 Pi Coin price analysis:
PI price invalidation lies near $0.32; if that breaks, the current pattern fails and fresh lows are likely.
Disclaimer: The content of this article solely reflects the author's opinion and does not represent the platform in any capacity. This article is not intended to serve as a reference for making investment decisions.
You may also like
A victory for retail investors! Wall Street short sellers suffer their worst performance in five years and are forced to "surrender"
Retail investors banding together are overwhelming professional short-sellers, as once-dominant Wall Street bears are experiencing their most painful defeat in five years. Wall Street elites, out of solutions, have begun to blame retail investors for being "irrational"...
A16Z's core capability is shilling and pumping.
VC is media; influence is power.

Curve team starts a new venture: Will YieldBasis become the next phenomenal DeFi application?
YieldBasis represents one of the most innovative designs in liquidity provision since the original stable swap model by Curve.

A $20 million entry ticket: Ten key Q&As on Hyperliquid HIP-3
Want to launch your own Perp DEX? Want to gain an in-depth understanding of HIP-3? Start by understanding these 10 key questions.