
Pi Network Token Could Be Preparing for a Breakout After All-Time Low

PI Network's token is showing bullish momentum after a period of consolidation, with key indicators like MACD and BBTrend signaling a potential breakout.
PI Network’s token has remained mostly sideways, showing signs of consolidation since it hit a new all-time low of $0.32 on August 1.
However, bullish momentum is emerging as buyers appear to capitalize on the dip. The question remains whether this growing optimism could translate into more gains in the coming session.
Selling Pressure Eases on PI Token
On the one-day chart, PI’s Moving Average Convergence Divergence (MACD) indicator is approaching a positive crossover, signaling a potential shift in momentum toward buying strength.
For token TA and market updates: Want more token insights like this? Sign up for Editor Harsh Notariya’s Daily Crypto Newsletter
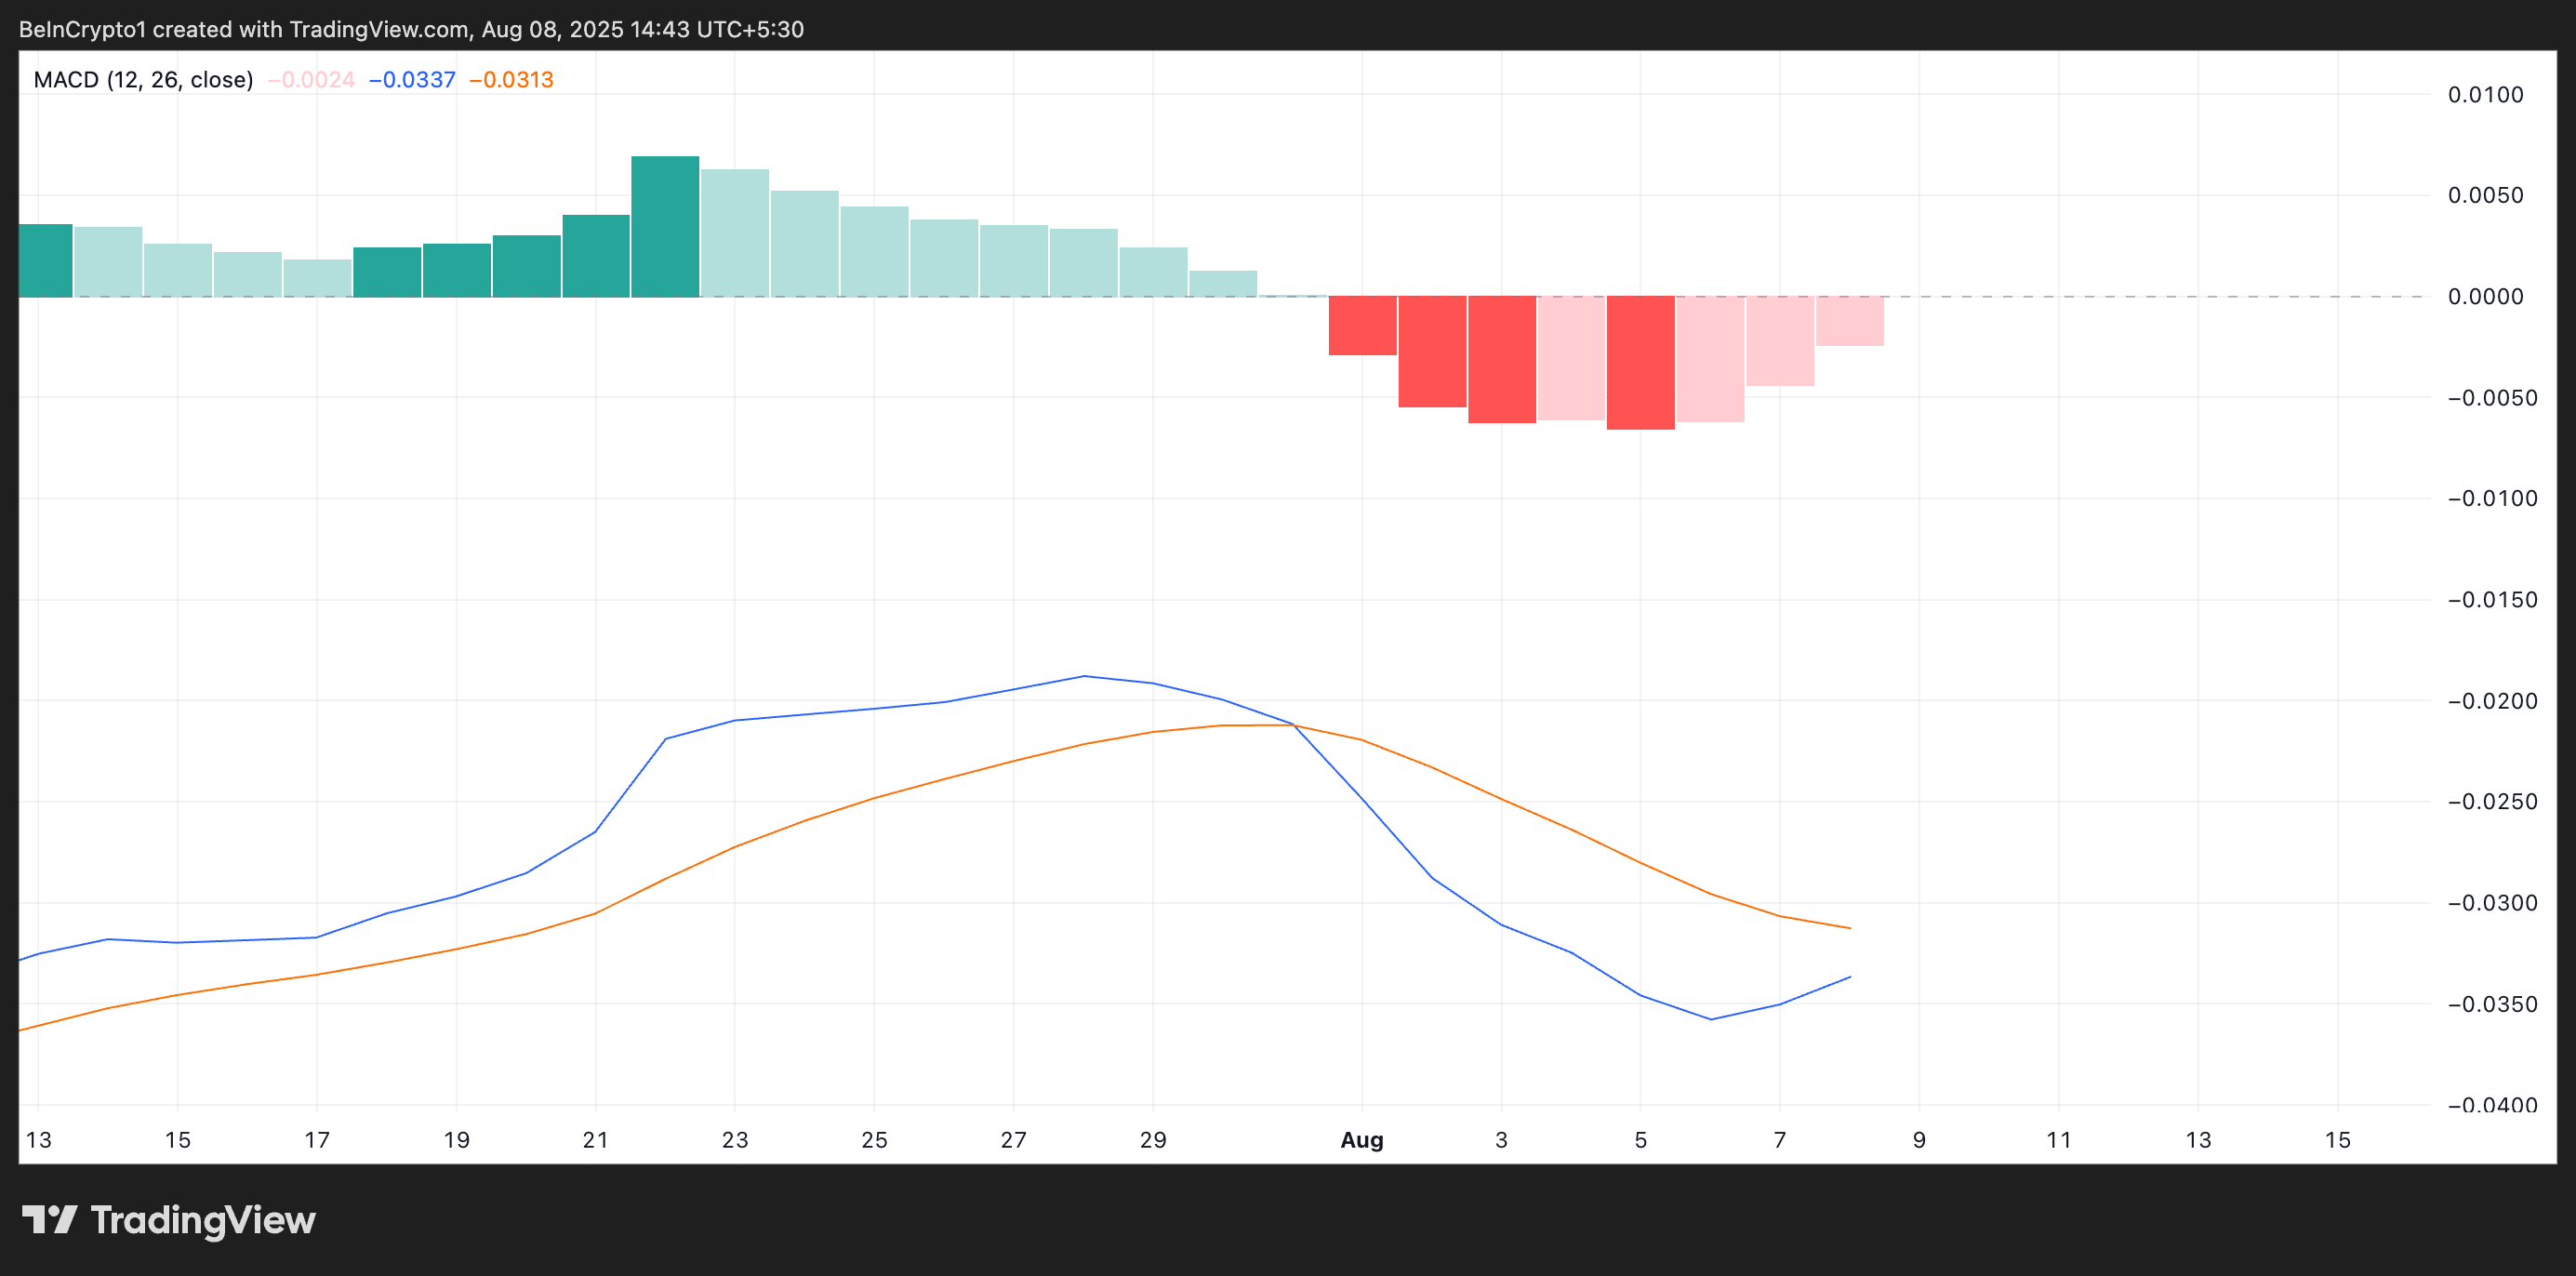 PI MACD. Source:
TradingView
PI MACD. Source:
TradingView
An asset’s MACD indicator identifies trends and momentum in its price movement. It helps traders spot potential buy or sell signals through crossovers between the MACD and signal lines.
A positive crossover occurs when the MACD line (blue) crosses the signal line (orange)
This is a bullish signal because it indicates that the asset’s short-term momentum is gaining strength relative to its longer-term trend. For PI, this means that buying interest is increasing and could push the price higher in the near term.
Additionally, readings from PI’s BBTrend indicator show a steady decline in the sizes of its red bars since the sideways trend began.
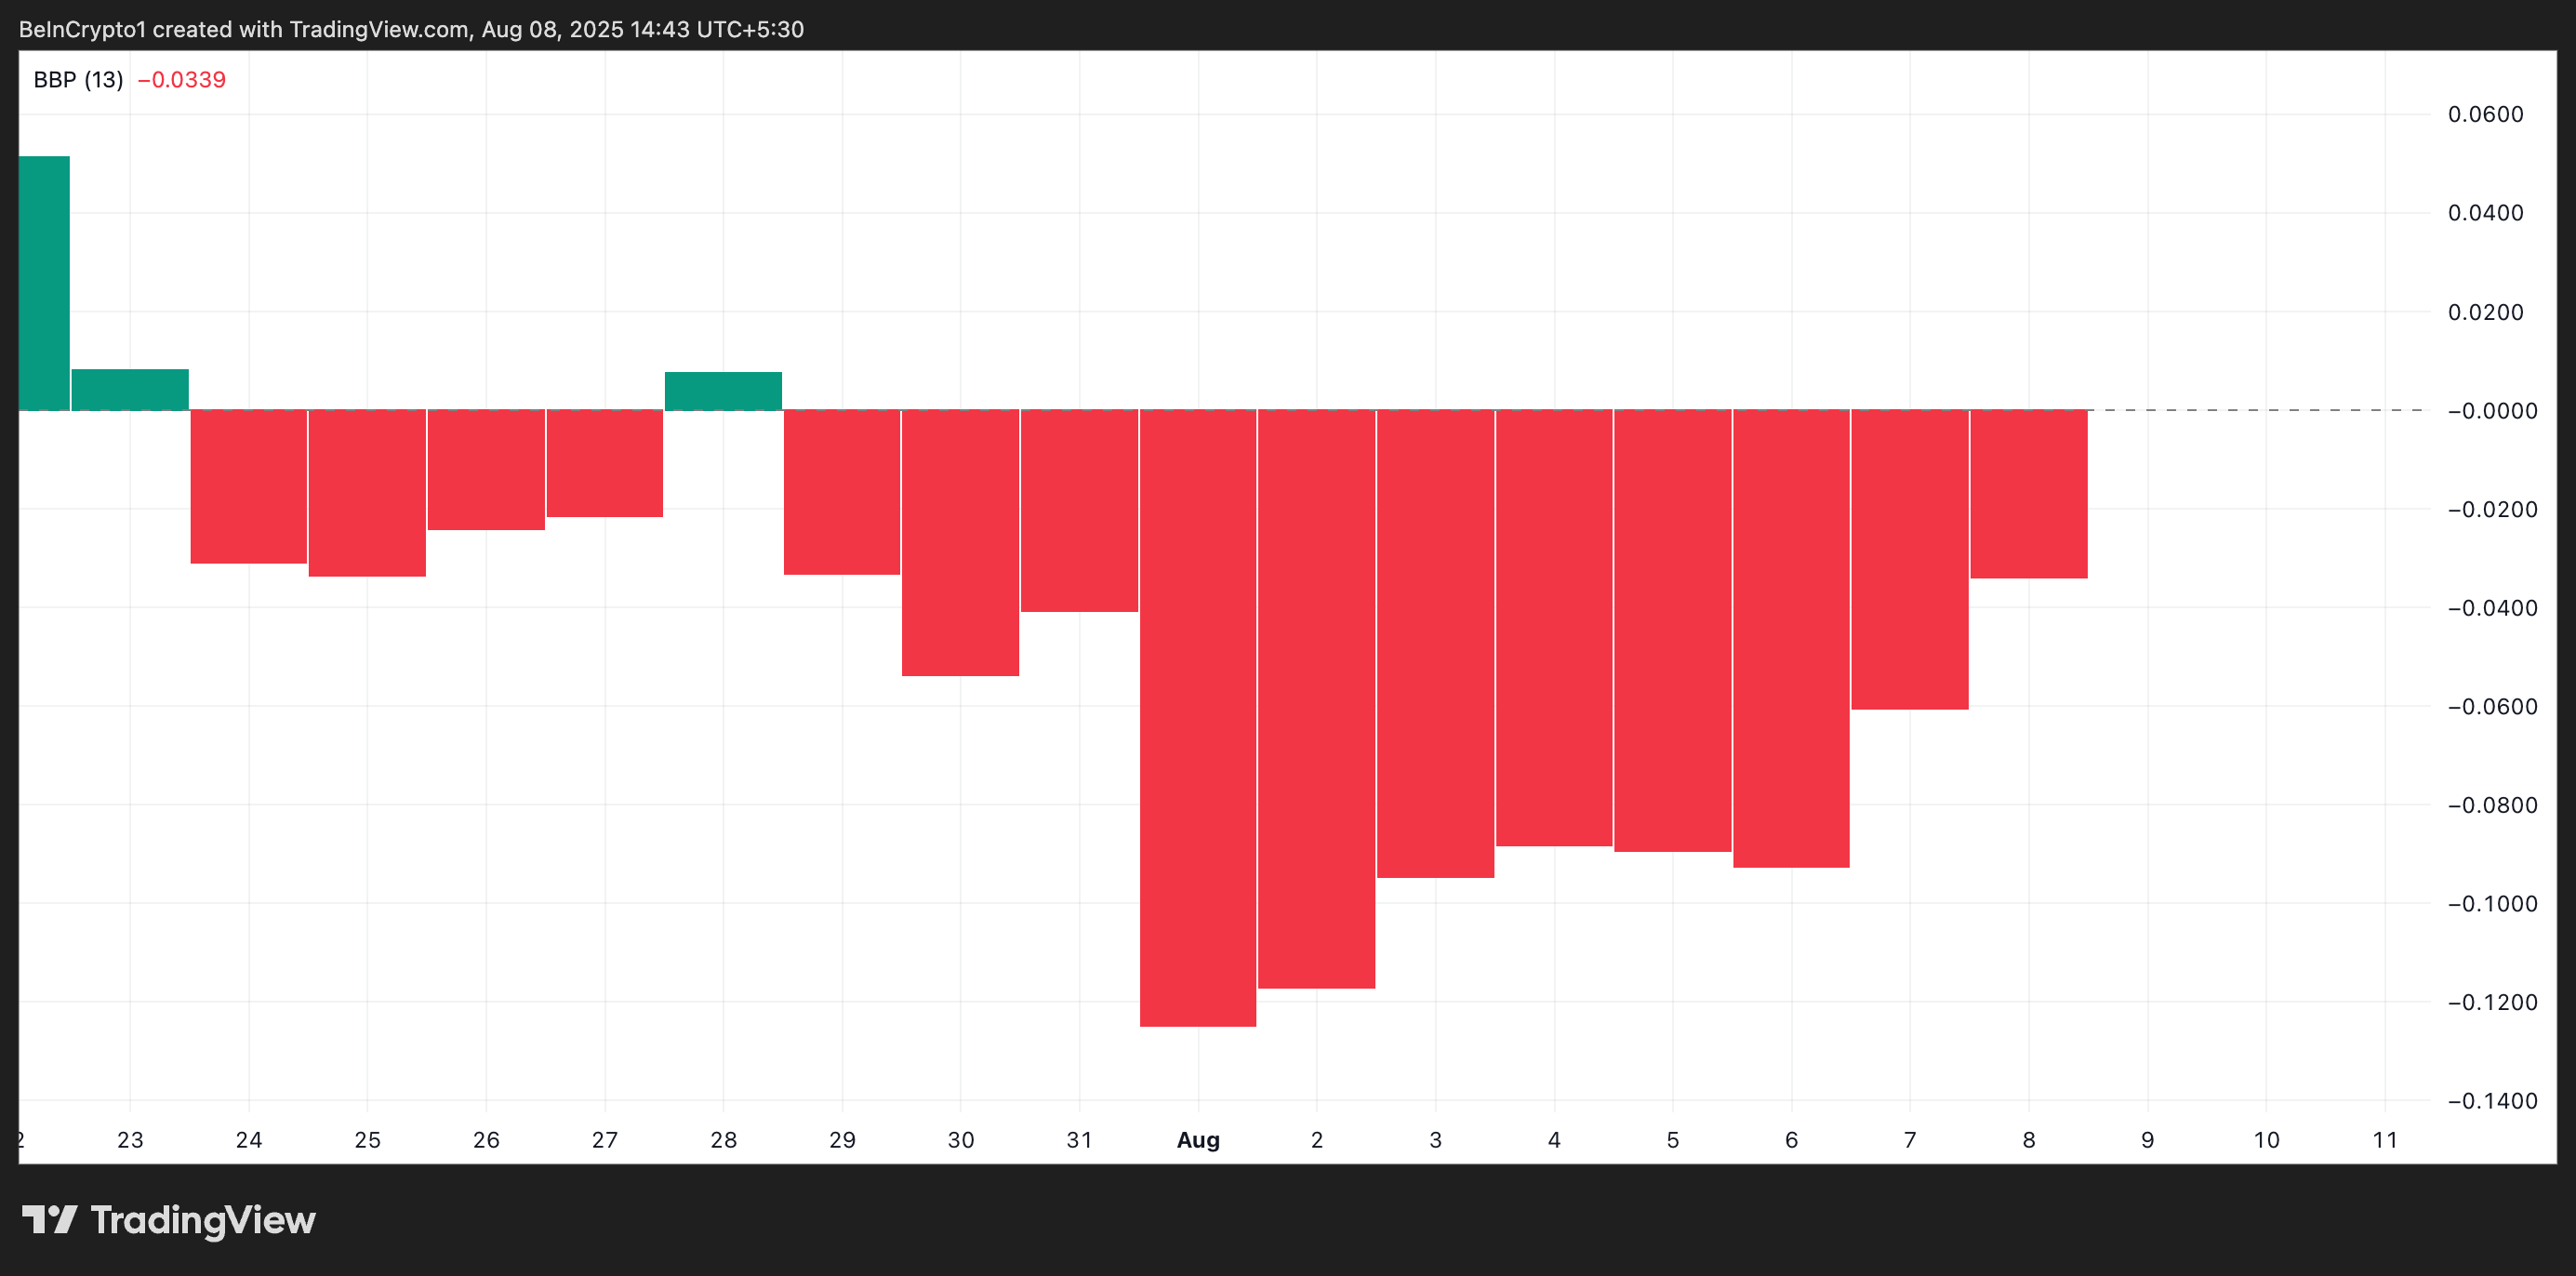 PI BBTrend. Source:
TradingView
PI BBTrend. Source:
TradingView
The BBTrend measures the strength and direction of a trend based on the expansion and contraction of Bollinger Bands. When it returns red bars, the asset’s price consistently closes near the lower Bollinger Band, reflecting sustained selling pressure.
However, when the sizes of these red bars start to drop, like with PI, selling pressure is easing, and the market sentiment is shifting towards buying.
PI Token’s Next Move Hinges on Demand
A sustained demand for PI could push it above the upper range of its horizontal channel, which forms resistance at $0.37. If successfully turned into a support floor, it could pave the way for a further rally to $0.44.
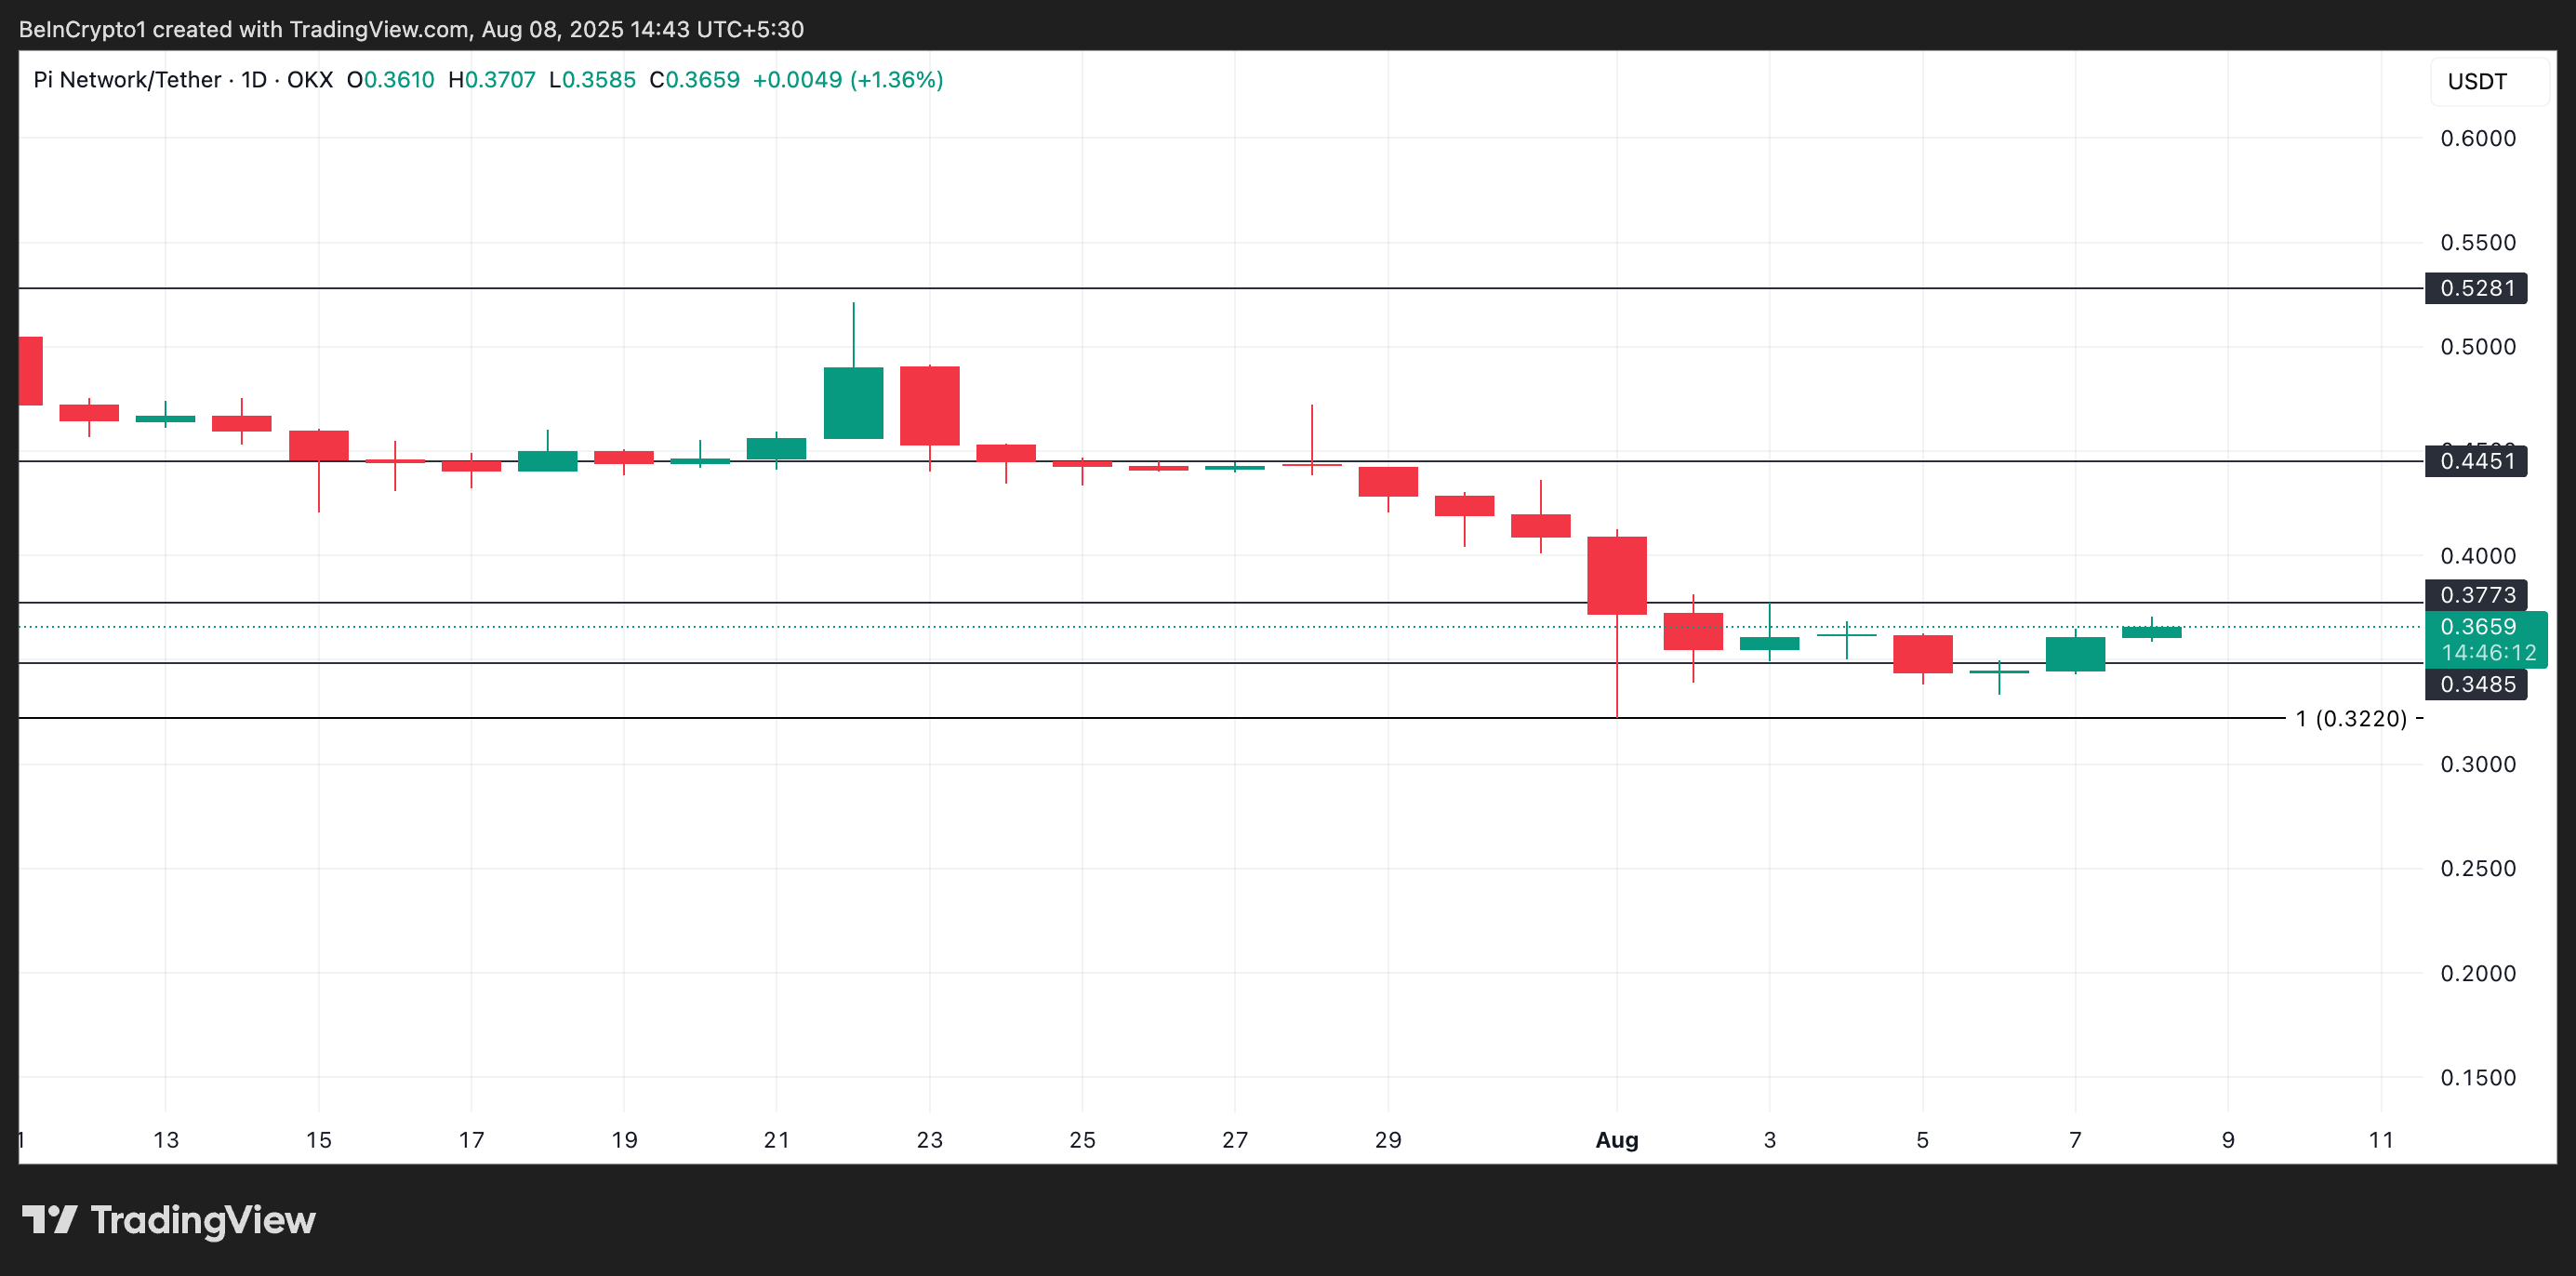 PI Price Analysis. Source:
TradingView
PI Price Analysis. Source:
TradingView
Conversely, if demand weakens again, PI could resume its sideways trend or fall under $0.34.
Disclaimer: The content of this article solely reflects the author's opinion and does not represent the platform in any capacity. This article is not intended to serve as a reference for making investment decisions.
You may also like
This Week's Preview: Macro "Flood Release" Week—Delayed CPI and the Bank of Japan's "Rate Hike Pursuit"
Key global market data will be released this week, including the U.S. non-farm payroll report, CPI inflation data, and the Bank of Japan's interest rate decision, all of which will significantly impact market liquidity. Bitcoin prices are fluctuating due to macroeconomic factors, while institutions such as Coinbase and HashKey are striving to break through via innovation and public listings. Summary generated by Mars AI This summary was generated by the Mars AI model. Its accuracy and completeness are still being iteratively improved.

Weekly Hot Picks: The Fed Cuts Rates and Indirectly "Injects Liquidity"! Silver Replaces Gold as the New Favorite?
The Federal Reserve is cutting interest rates and starting bond purchases, while Japan and other regions may turn to rate hikes. Silver repeatedly hits record highs, SpaceX is set for a 1.5 trillion IPO, and Oracle becomes the litmus test for the AI bubble. The Russia-Ukraine peace process is stuck on territorial issues, the US seizes a Venezuelan oil tanker... What exciting market events did you miss this week?

Key Highlights to Watch at Solana Breakpoint 2025
How does Solana seize market share in an increasingly competitive landscape?

Crucial Alert: ZRO Leads This Week’s $100M+ Token Unlocks – What Investors Must Know