Date: Sat, Aug 16, 2025 | 10:20 AM GMT
The cryptocurrency market is taking a breather as Ethereum (ETH) cools off to $4,400 from its recent $4,780 peak, marking a 5% drop over the past 24 hours. The pullback has applied pressure across most major altcoins .
Yet, XRP is standing firm, showing relative strength as it trades in the green. More importantly, a well-recognized harmonic pattern is taking shape on its chart, potentially signaling that XRP’s next move could be higher.
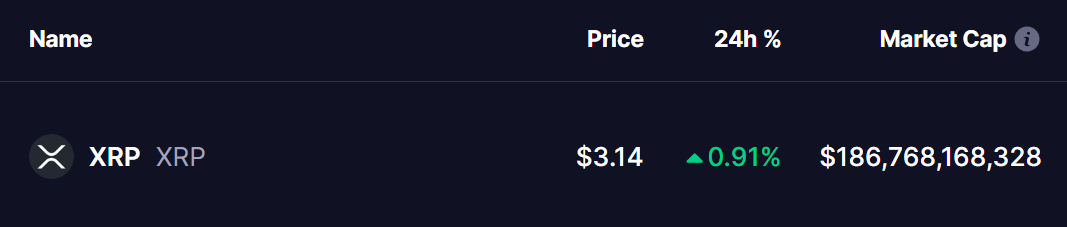 Source: Coinmarketcap
Harmonic Pattern Hints at Potential Upside
On the 4-hour chart, XRP is forming a Bearish Butterfly harmonic pattern. Despite the bearish name, this setup often fuels bullish continuations during its final leg (CD), as price stretches into the completion zone.
The structure began at point X near $3.66, before XRP slid to point A, then rebounded to point B, and corrected again to point C around $2.98. Since then, the token has been climbing back up, now changing hands near $3.14.
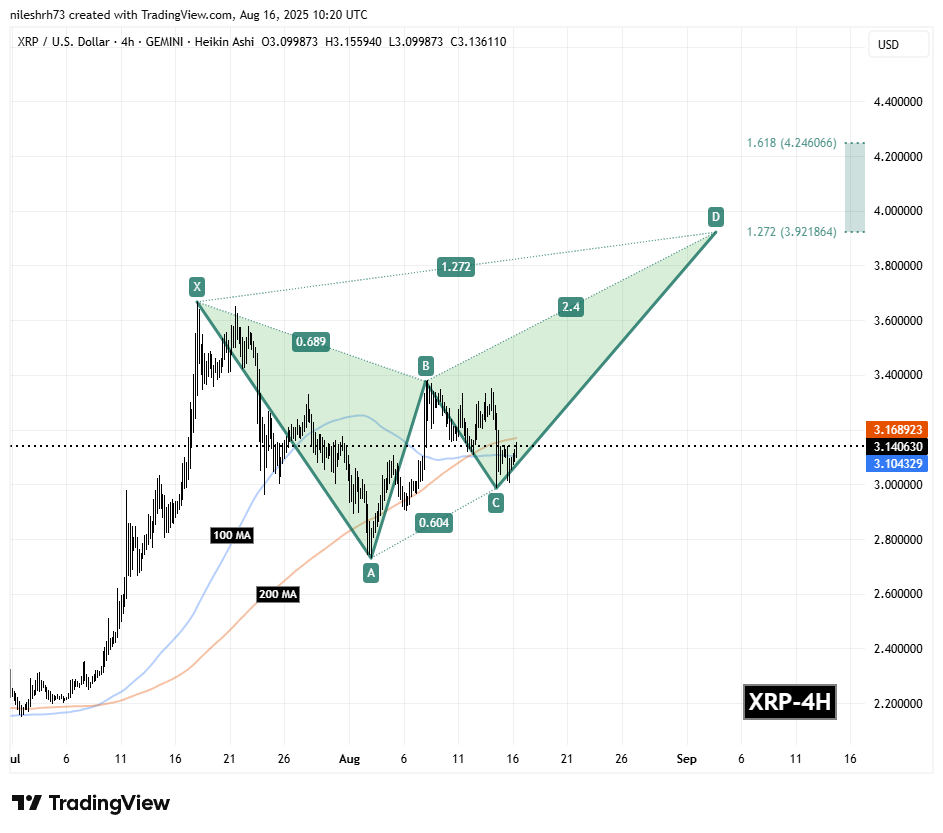 XRP 4H Chart/Coinsprobe (Source: Tradingview)
Adding to the intrigue, XRP is approaching its 200-period moving average at $3.16. This level is now emerging as a short-term resistance and could be a decisive confirmation point for the pattern’s next leg higher.
What’s Next for XRP?
If buyers can push XRP through the 200-day MA with conviction, it would strengthen the case for a move toward the Potential Reversal Zone (PRZ). This key area stretches from $3.92 (the 1.272 Fibonacci extension) to $4.26 (the 1.618 Fib extension). These are traditional completion zones for the Butterfly pattern, where price often exhausts before either consolidating or reversing.
On the flip side, for this bullish scenario to remain valid, XRP must maintain support above both its 100-day MA and the C point near $2.98. A failure to defend these levels would undermine the harmonic setup and possibly delay or cancel the breakout move.