Mantle (MNT) Price Prediction for August 20

The Mantle price is currently $1.38, which is 8% higher than its daily low of $1.29. Buyers came in near channel support, and the recovery has pushed MNT back toward the $1.40 zone, which is a key level of resistance. This move comes as momentum signals are getting better across a number of indicators, and the price is still inside a rising channel structure.
Mantle Price Forecast Table: August 20, 2025
| Indicator/Zone | Level / Signal |
| Mantle price today | $1.38 |
| Resistance 1 | $1.40 (Breakout Level) |
| Resistance 2 | $1.47 / $1.55 |
| Support 1 | $1.32–$1.34 (Near-term base) |
| Support 2 | $1.29 (Channel support) |
| RSI (1H) | 70.4 (Overbought) |
| MACD (1H) | Bullish crossover |
| CMF (4H) | +0.29 (Capital inflow) |
| EMAs (20/50/100/200, 4H) | Bullish alignment |
| Supertrend (1H) | Bullish above $1.29 |
| DMI (1H) | +DI leads, ADX rising |
| Bollinger Bands (4H) | Expanding, volatility signal |
What’s Happening With Mantle’s Price?
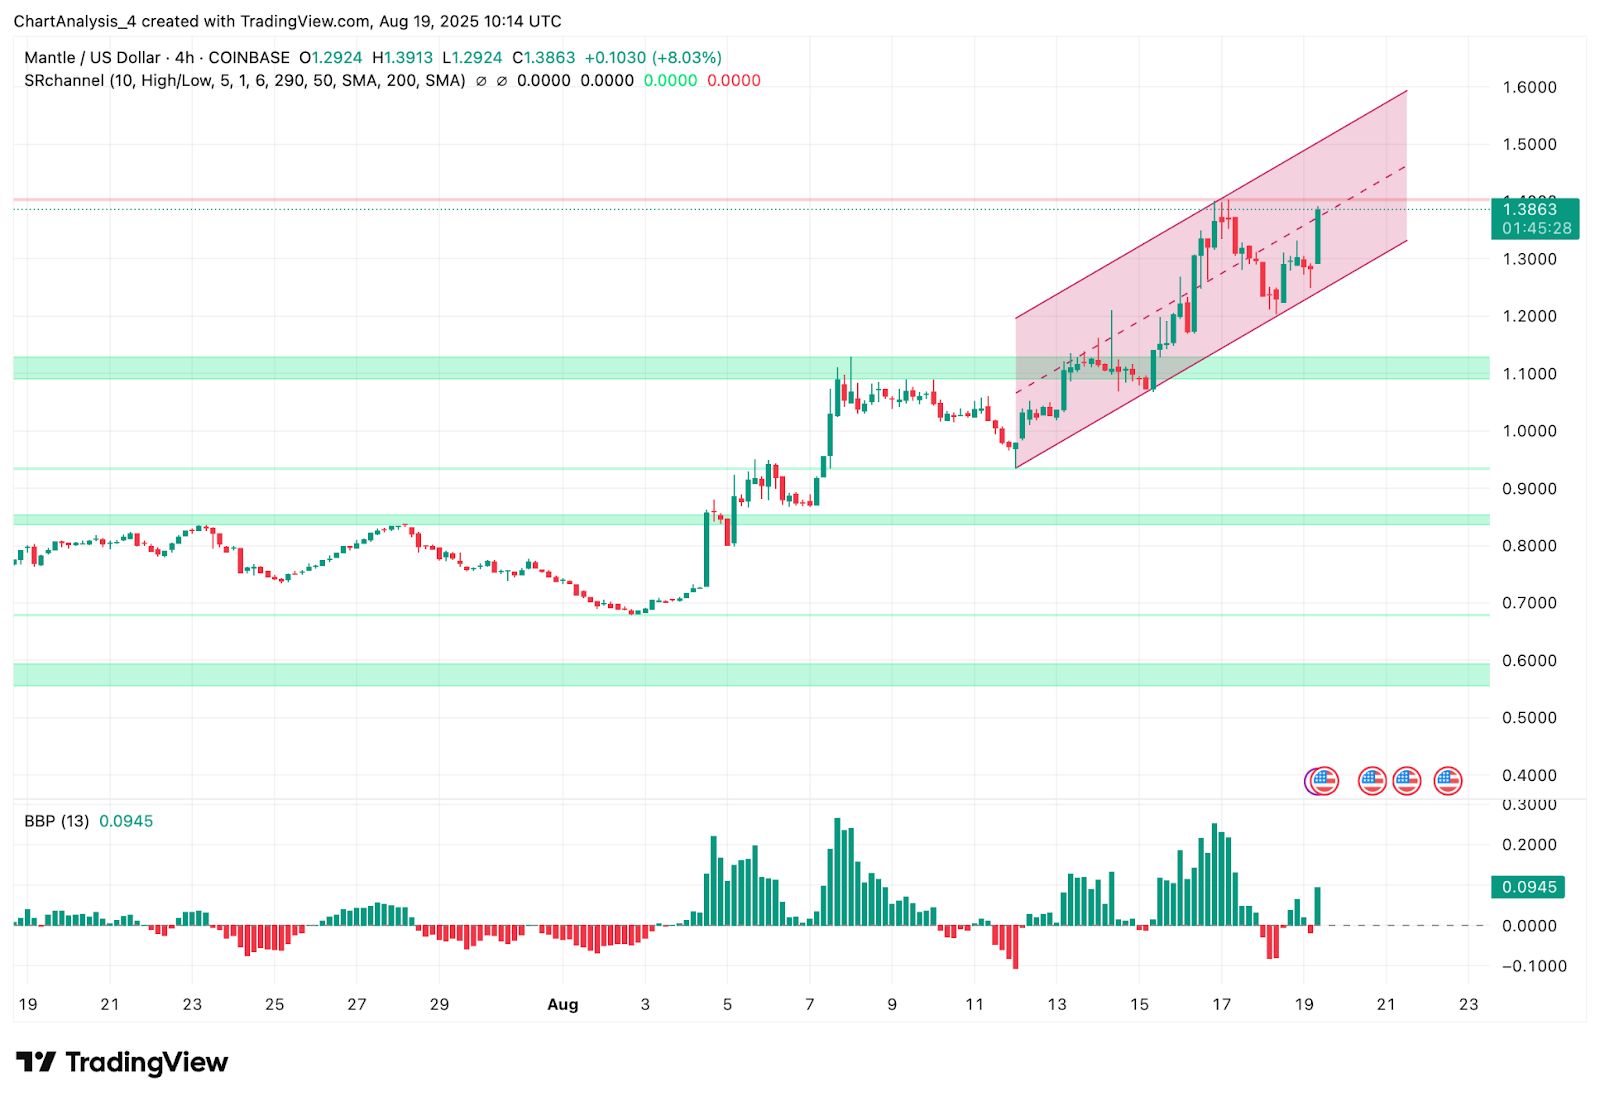
Since mid-August, Mantle has been moving up and down in an ascending channel, with higher lows providing steady structural support. The price bounced sharply off the channel floor around $1.29 on the 4-hour chart and is now testing the upper midline near $1.40. Volume analysis shows that there was a clear increase during the rebound, and the Balance of Power (BBP) is in the positive range, which adds to the bullish momentum.
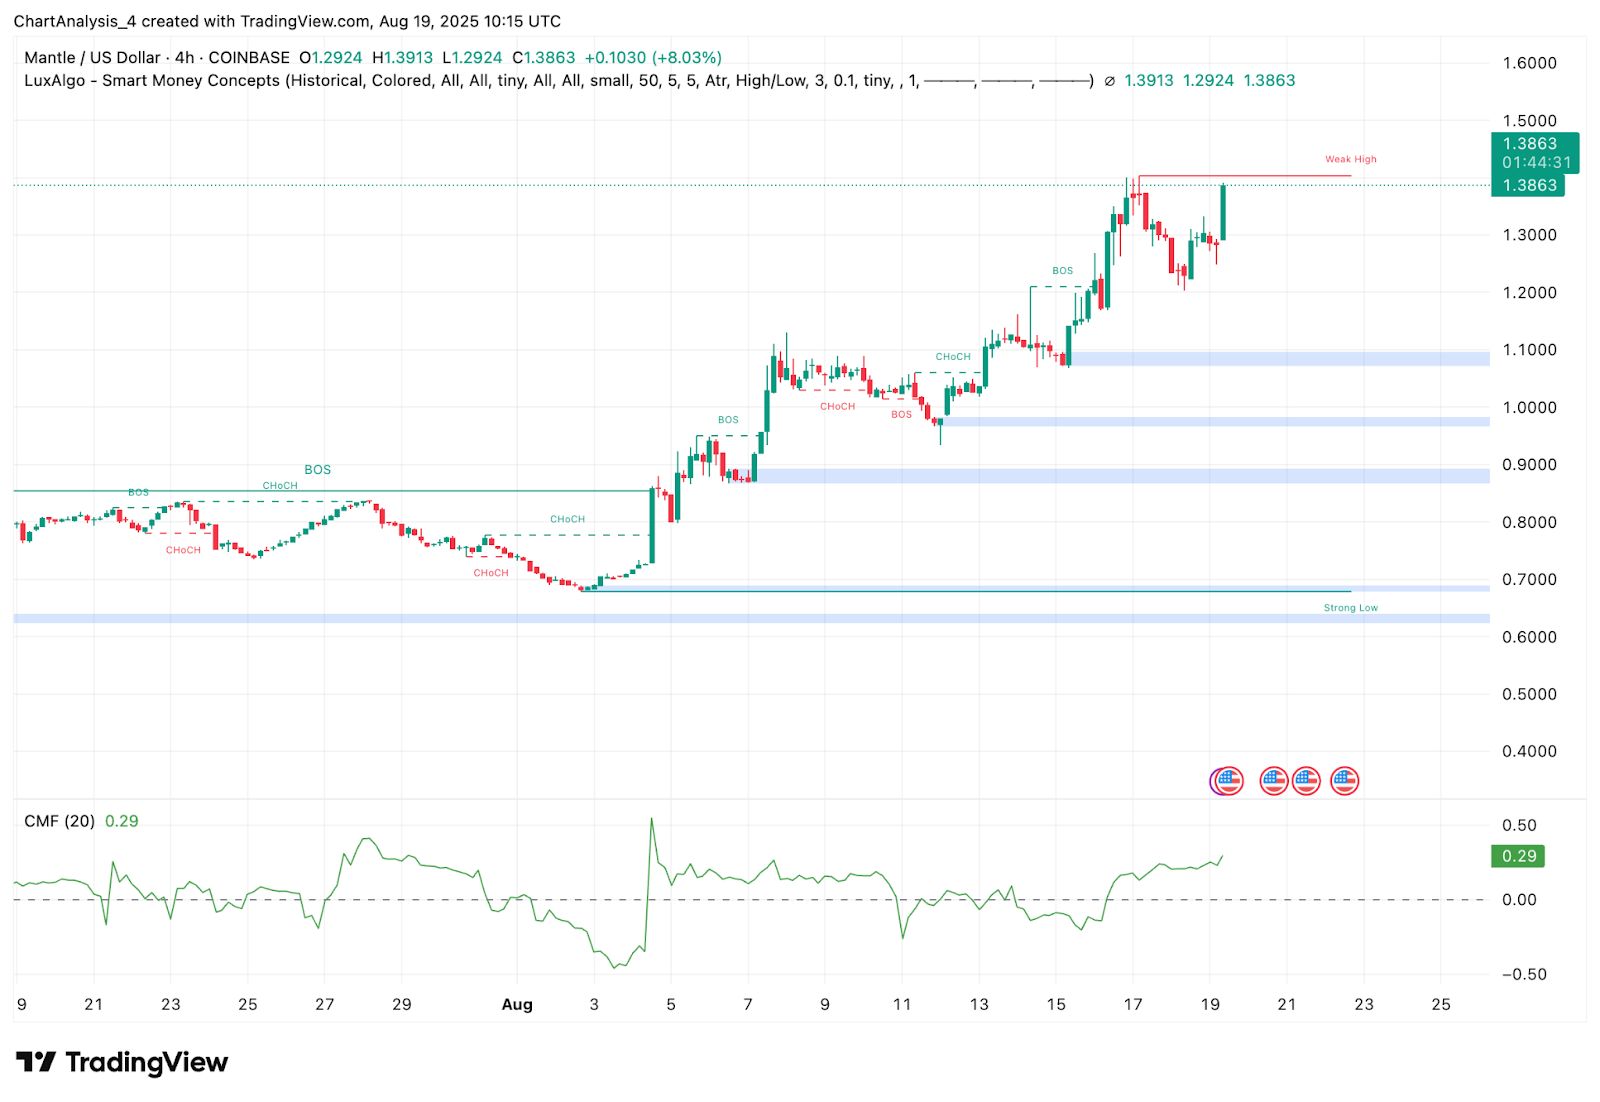
Smart Money Concepts (SMC) show that there have been multiple Breaks of Structure (BOS) in the past week, which shows strength in reclaiming liquidity zones.
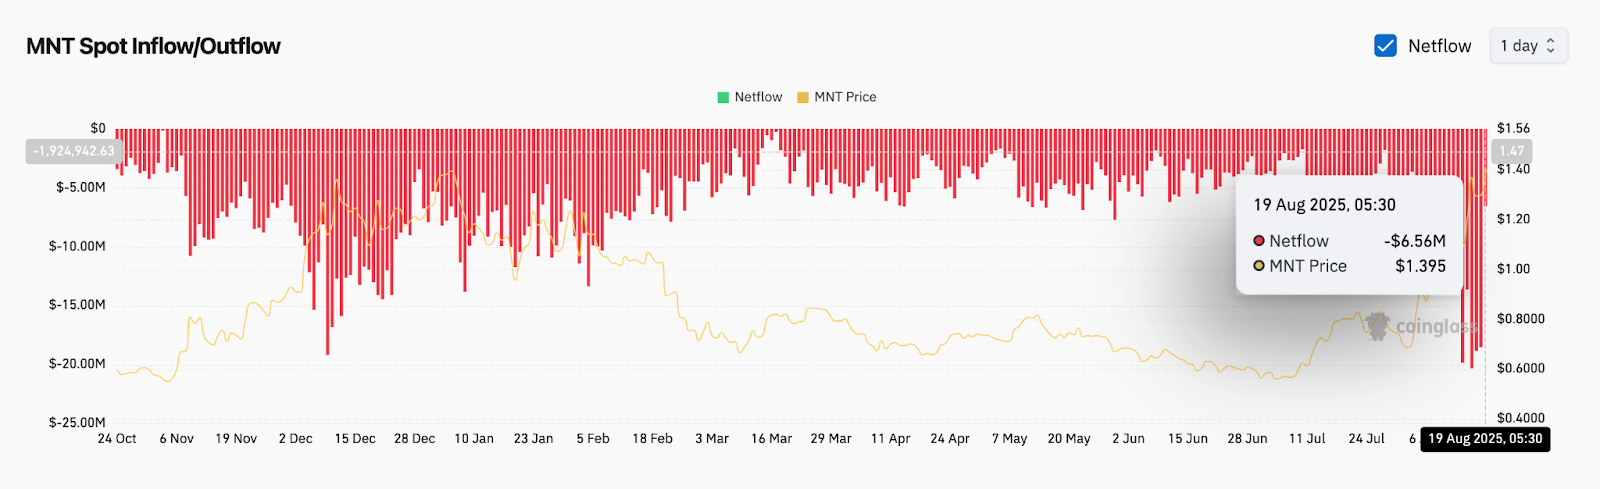
On-chain data also reveals that while $6.5M in net outflows occurred on August 19, spot price remained resilient above $1.30. This suggests that despite selling pressure, demand at lower levels continues to absorb liquidity.
Why Is The Mantle Price Going Up Today?
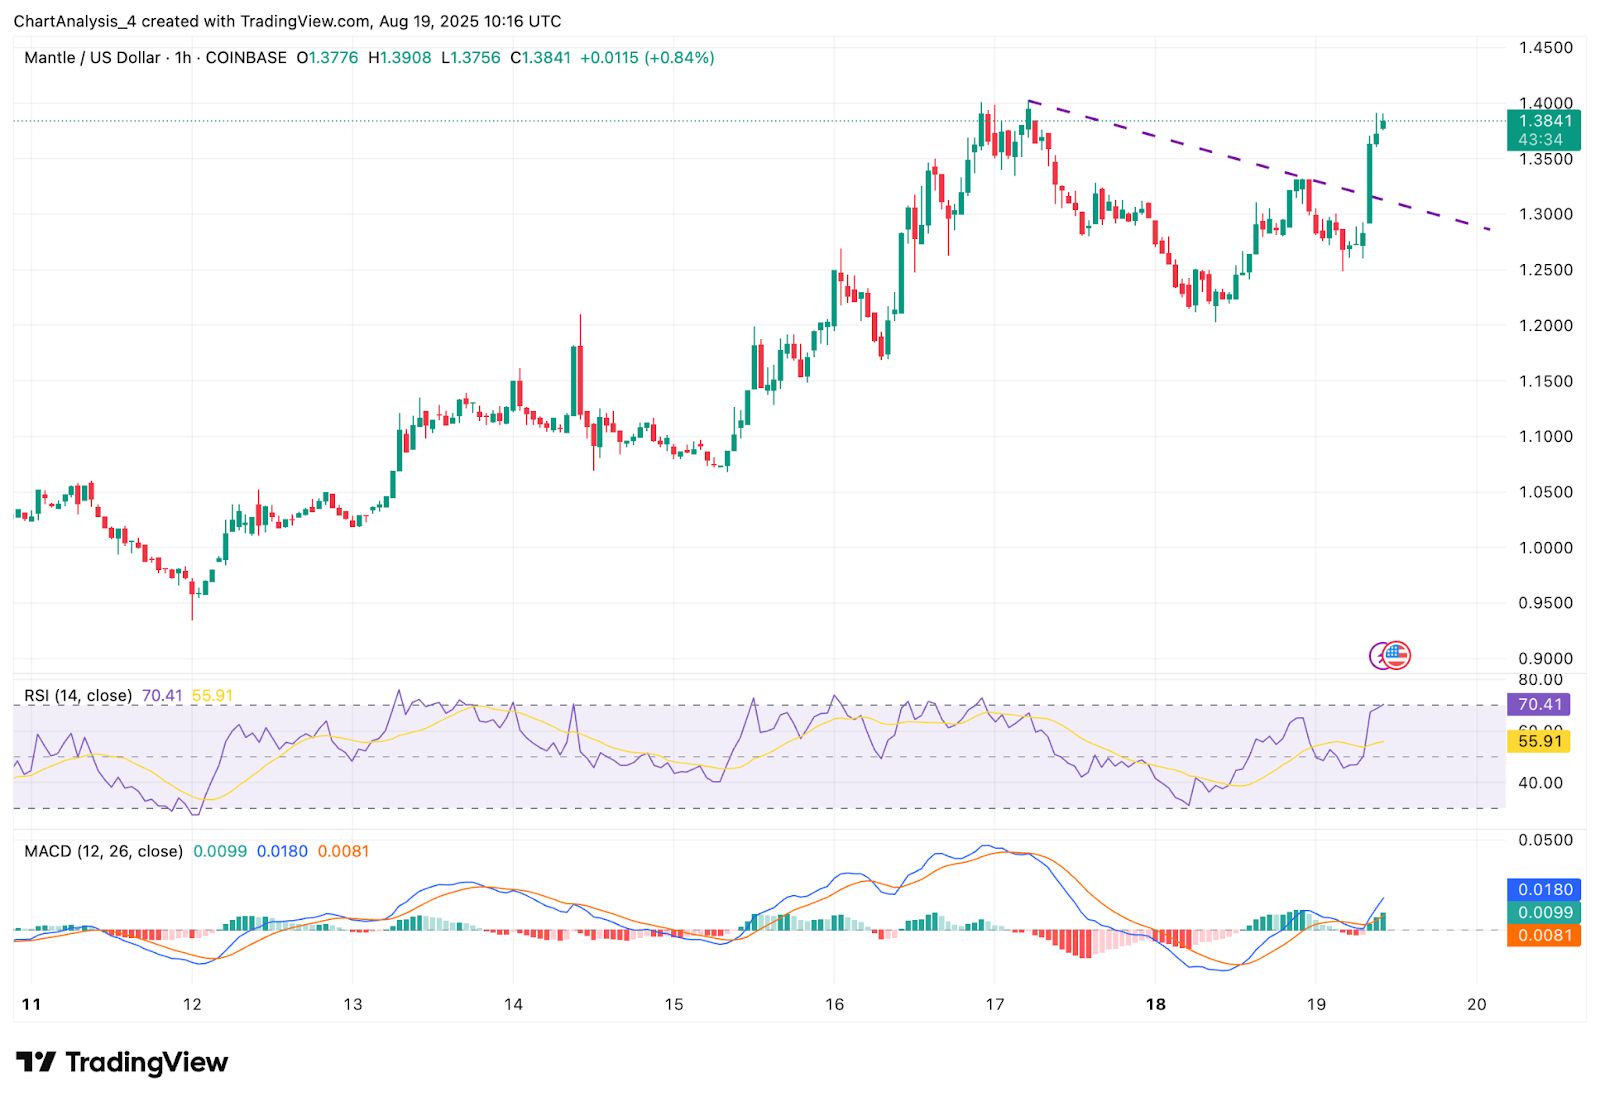
The immediate reason why Mantle price going up today is tied to a clean breakout attempt from its intraday downtrend. On the 1-hour chart, MNT broke a descending resistance line and spiked above $1.35 with strong follow-through.
RSI has surged to 70, moving into overbought territory, reflecting renewed bullish demand. Meanwhile, MACD has flipped into positive crossover, confirming upside bias after a period of consolidation.
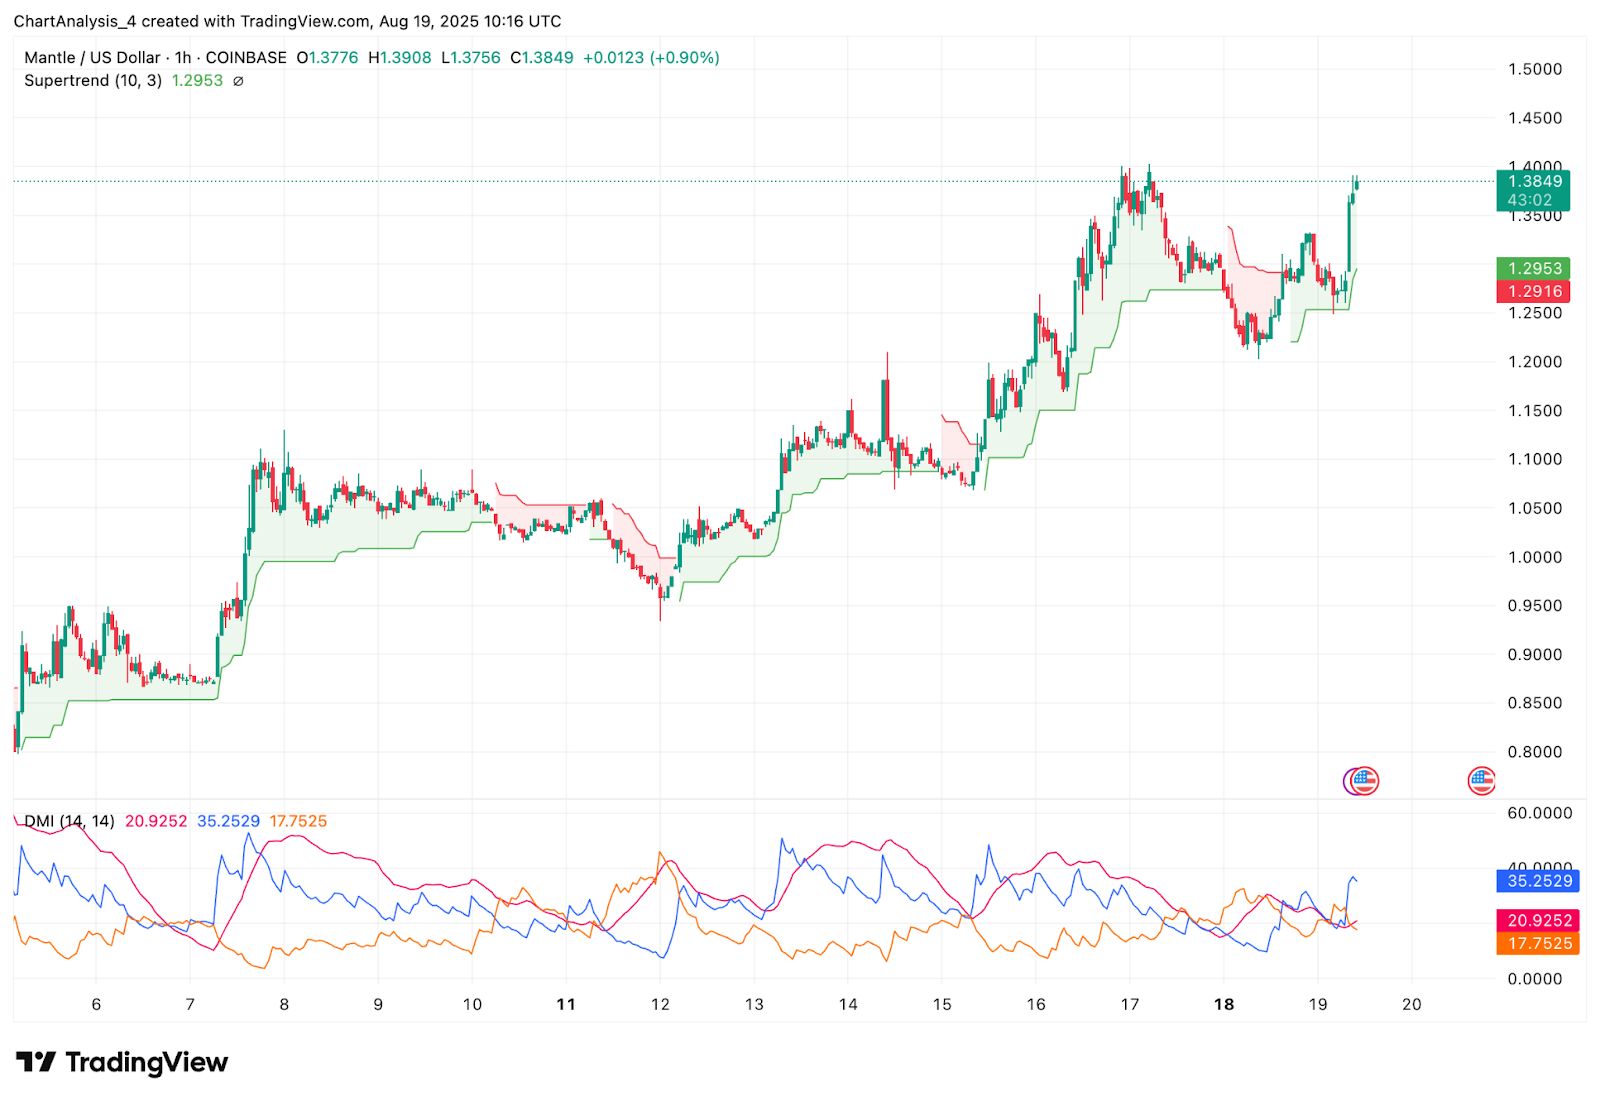
Supertrend has also turned bullish above $1.29, and the DMI shows +DI crossing above -DI with ADX rising above 20, signaling trend strength. Together, these alignments highlight strong buyer control in the short term.
Mantle Price Indicators Signal Breakout Potential
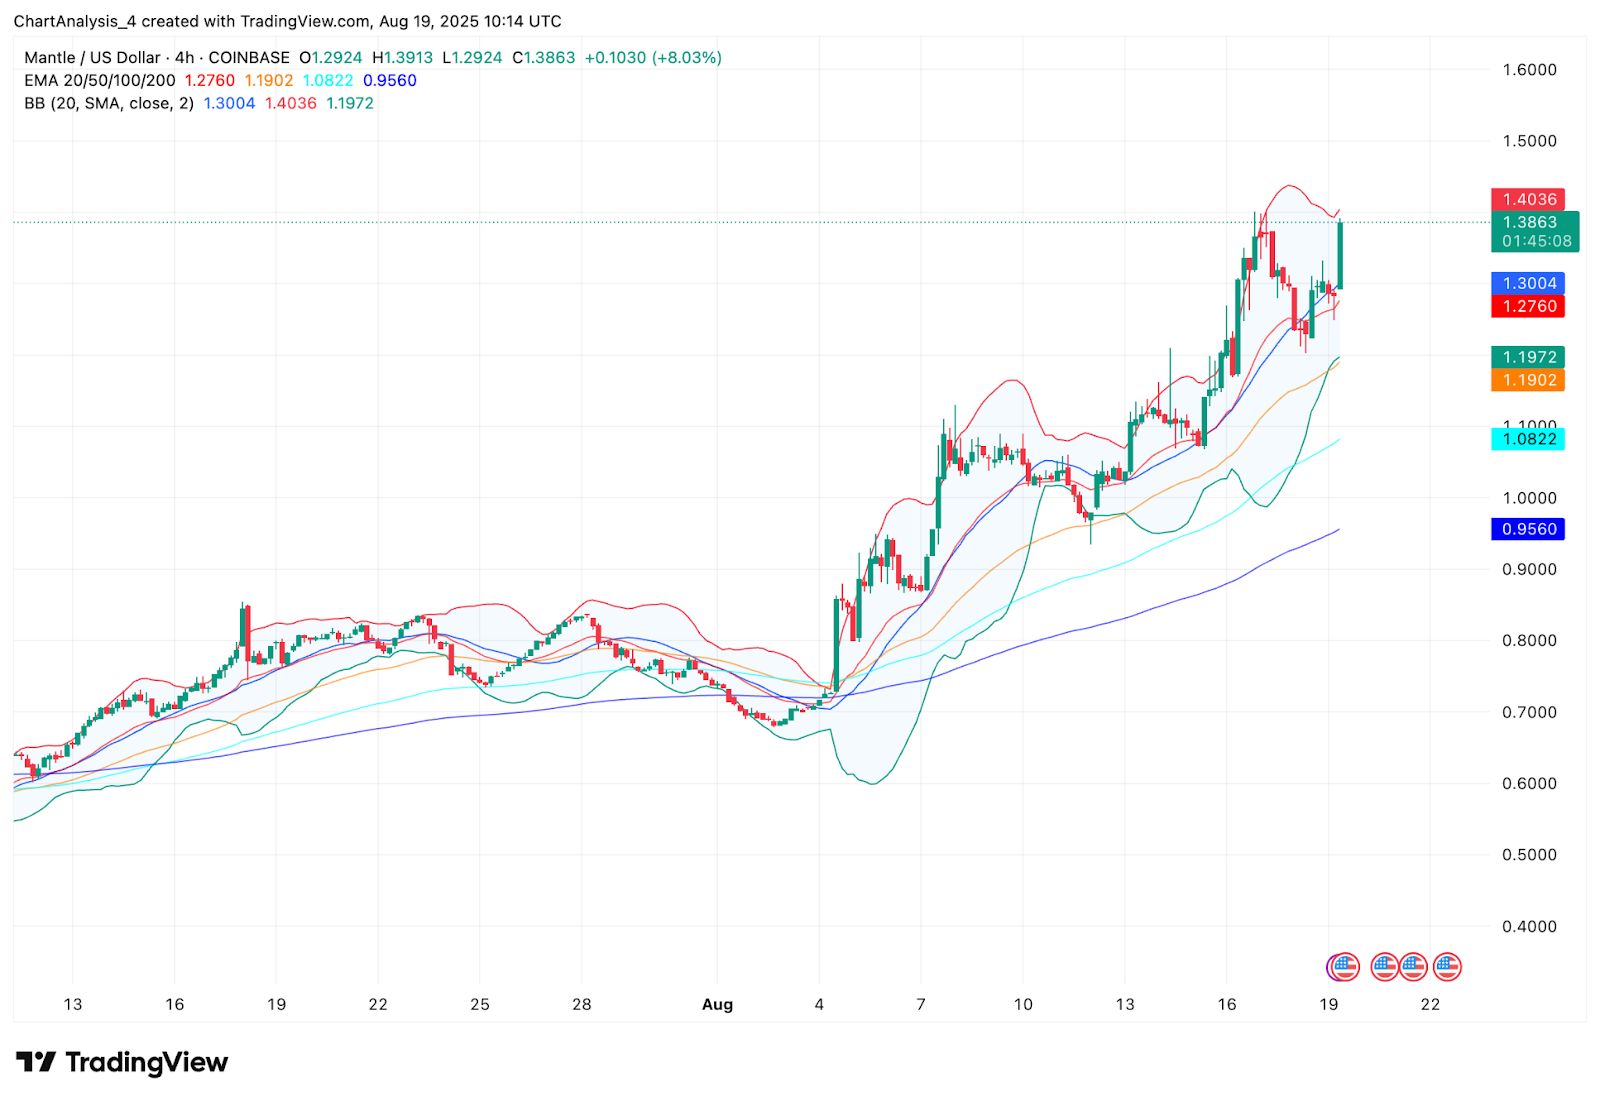
The Bollinger Bands on the 4-hour chart are expanding after a period of compression, suggesting volatility expansion is underway. Price is currently pressing against the upper band at $1.40, with EMAs stacked favorably below: EMA20 at $1.27, EMA50 at $1.19, EMA100 at $1.08, and EMA200 at $0.95. This EMA alignment confirms a bullish dynamic structure.
The Chaikin Money Flow (CMF) is also firmly positive at 0.29, reflecting steady capital inflows despite net exchange outflows. This divergence highlights strong accumulation behavior.
If price closes decisively above $1.40, the bullish breakout setup could extend toward $1.50 and higher.
MNT Price Prediction: Short-Term Outlook (24H)
In the next 24 hours, Mantle will need to hold above $1.32–$1.34 support to maintain bullish structure. A successful breakout above $1.40 could trigger rapid momentum toward $1.47 and then $1.55.
On the downside, a failure to close above $1.40 may lead to a pullback toward $1.29 channel support. A break below that would risk retesting $1.20 and invalidate the current bullish setup.
With RSI nearing overbought and Bollinger Bands showing expansion, short-term volatility is expected. Traders should watch closely for confirmation above $1.40 to validate the bullish continuation.
Disclaimer: The content of this article solely reflects the author's opinion and does not represent the platform in any capacity. This article is not intended to serve as a reference for making investment decisions.
You may also like
EIGEN Large Unlock Incoming: 10% Market Cap Dilution Each Month, Smart Money Exits Early
The article, based on on-chain data analysis, points out that the recent sharp decline of the $EIGEN token (a 53% plunge on October 10) is not merely a result of market panic, but rather a manifestation of a deeper underlying issue. The real core risk lies in the massive and continuous token unlocks over the next two years, which will exert tremendous selling pressure. The smartest and most profitable traders had already anticipated this and systematically exited their positions weeks before the market crash.

How does market microstructure determine the real movement of candlestick charts?

Which crypto and AI projects will take the lead in the x402 payment protocol?

Bitcoin falls below $110,000 again, when will market panic end?