HBAR Price Finds One Bullish Anchor as Buyers Move Away – What To Expect Next?

HBAR price is still showing signs of weakness on longer timeframes, but one short-term bullish signal on the RSI chart has emerged. Outflows are slowing, price action is stuck in a tight zone, and the market now waits to see if this lone signal can offer a temporary push.
HBAR’s price has struggled to maintain a steady uptrend over the past month. After a 10.7% decline over 30 days, the token has managed a mild 1.24% gain in the past 24 hours.
While its 3-month chart still shows a 16.4% increase, the recent action signals growing reliance on shorter-term spikes rather than sustained rallies. Despite the broader weakness, one bullish pattern has emerged. The 4-hour RSI is starting to tell a different story — but whether it’s enough to hold the price up remains to be seen.
RSI Flashes Divergence But Buyers Retreat
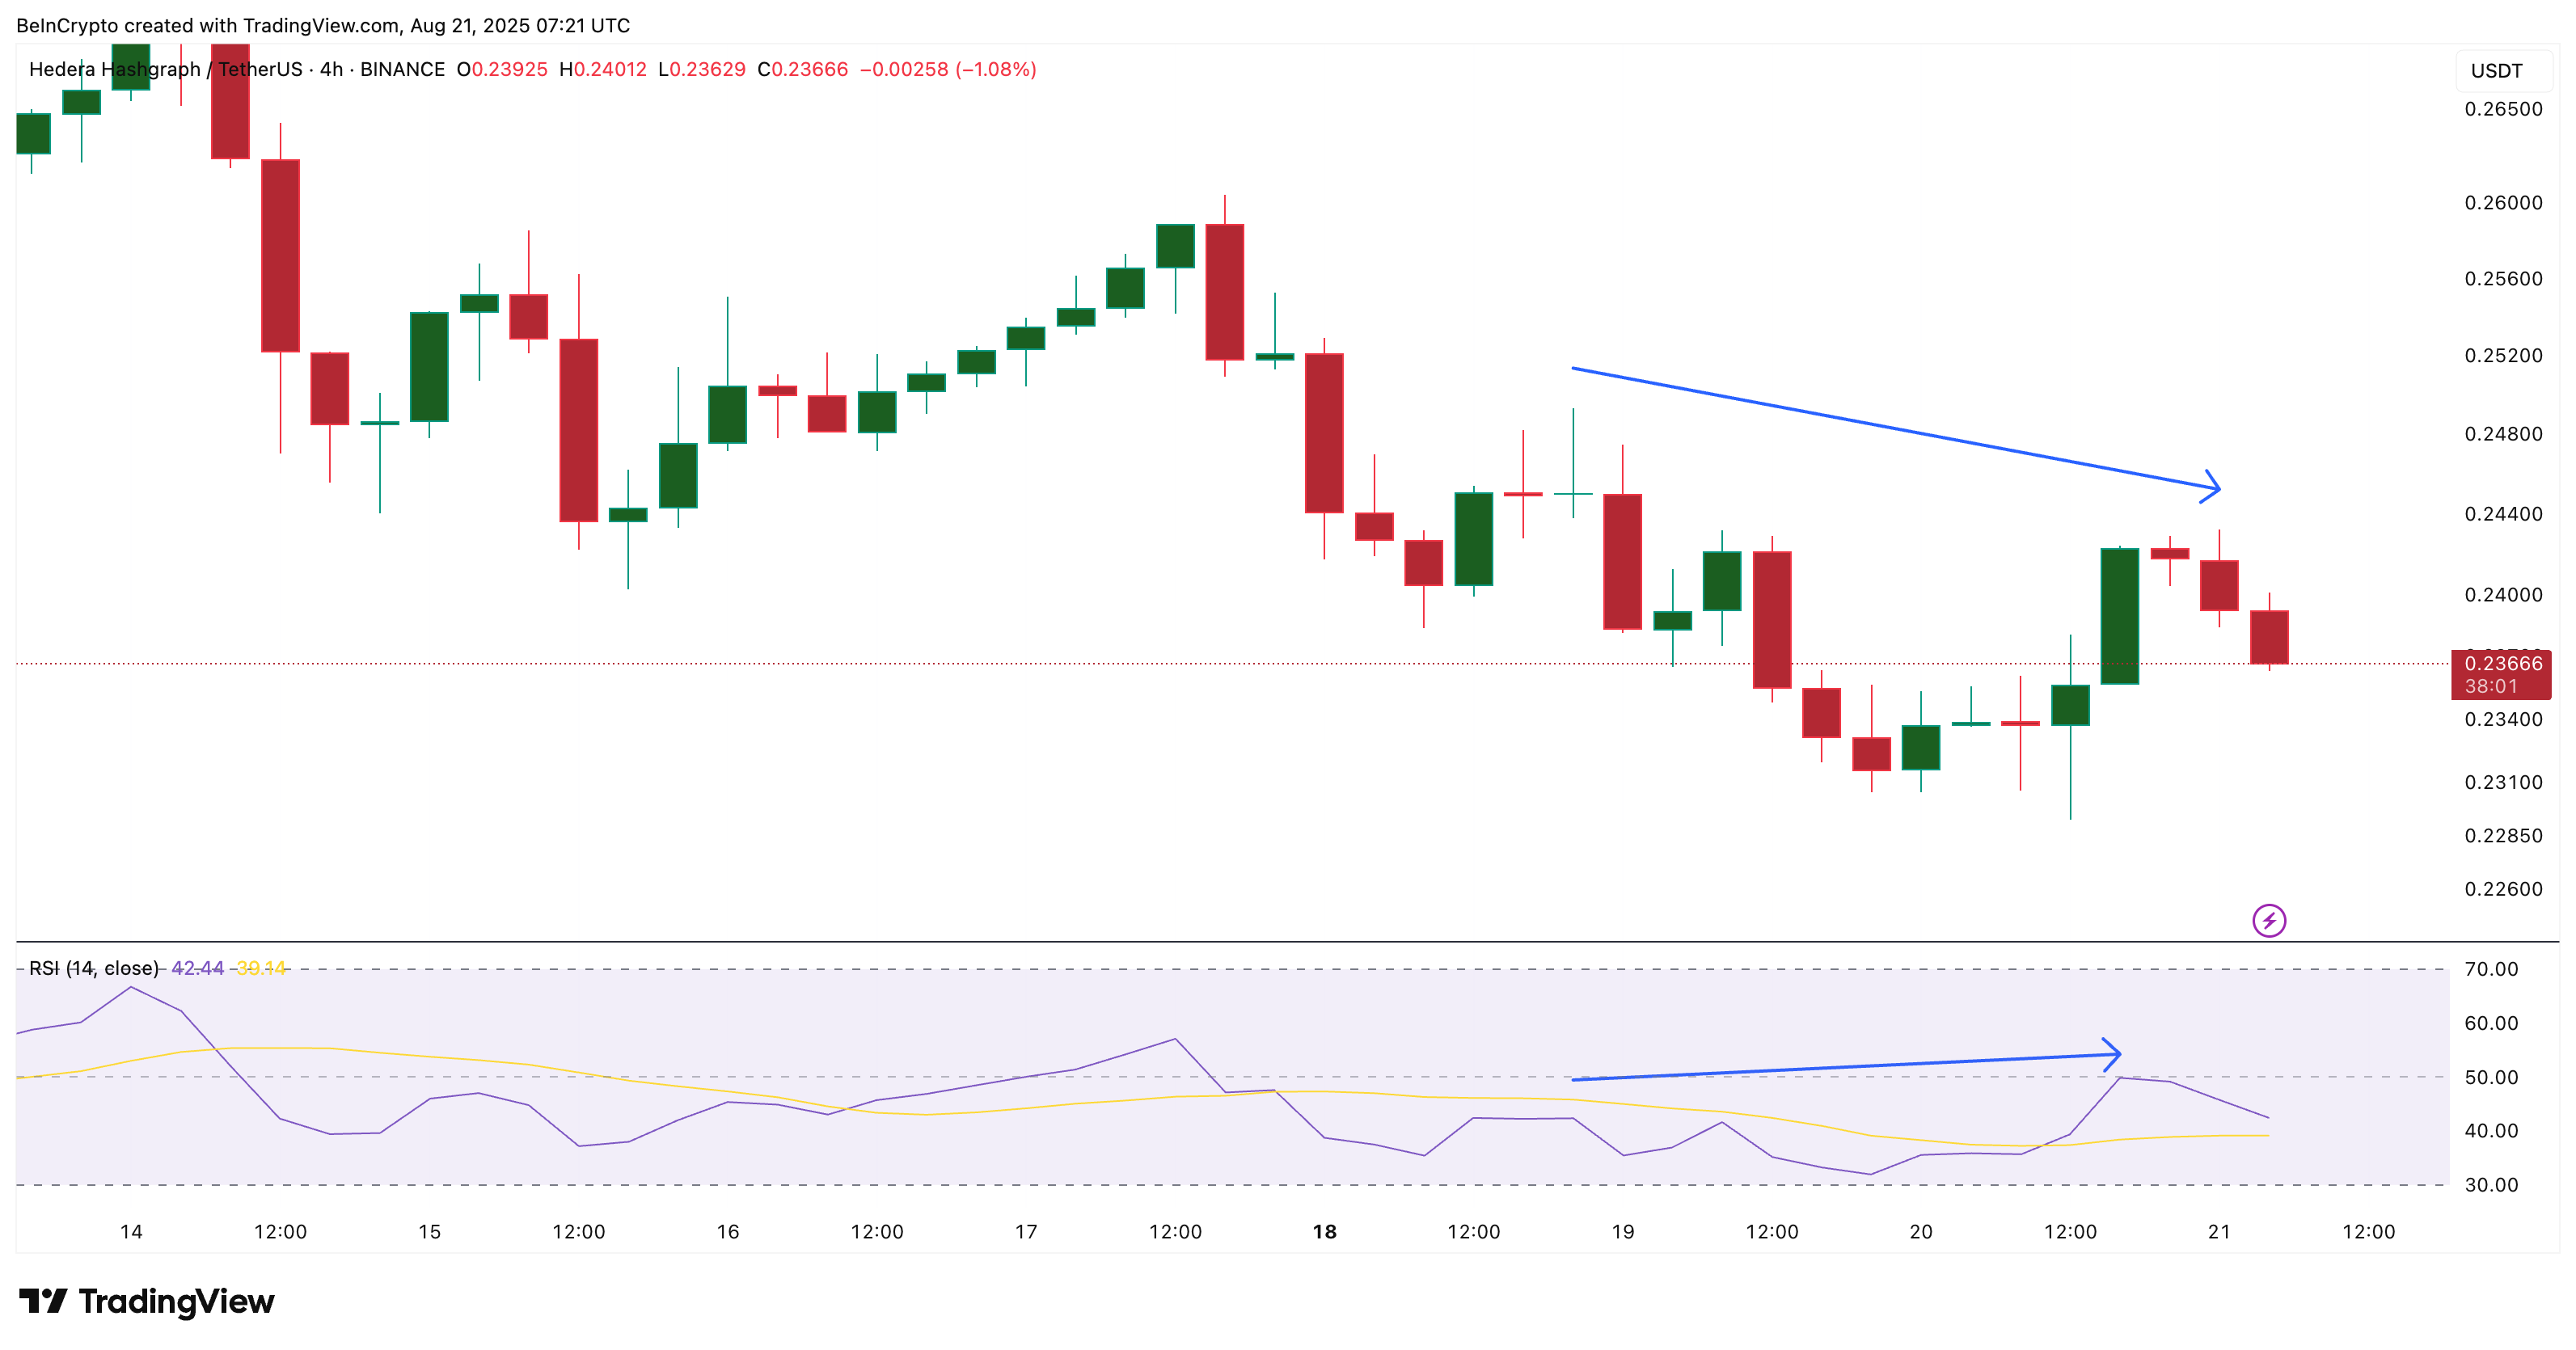
The Relative Strength Index (RSI) is a momentum tool that shows whether buyers or sellers have more control. The Relative Strength Index (RSI) on HBAR’s 4-hour chart shows a subtle bullish divergence.
 HBAR price and bullish divergence:
HBAR price
HBAR price and bullish divergence:
HBAR price
Between August 18 and August 20, the HBAR price formed a lower high, but the RSI climbed higher during the same period. This divergence usually hints that buying momentum is attempting to return — at least in the short term — even as the price struggles to break resistance.
 HBAR sellers are gaining control:
Coinglass
HBAR sellers are gaining control:
Coinglass
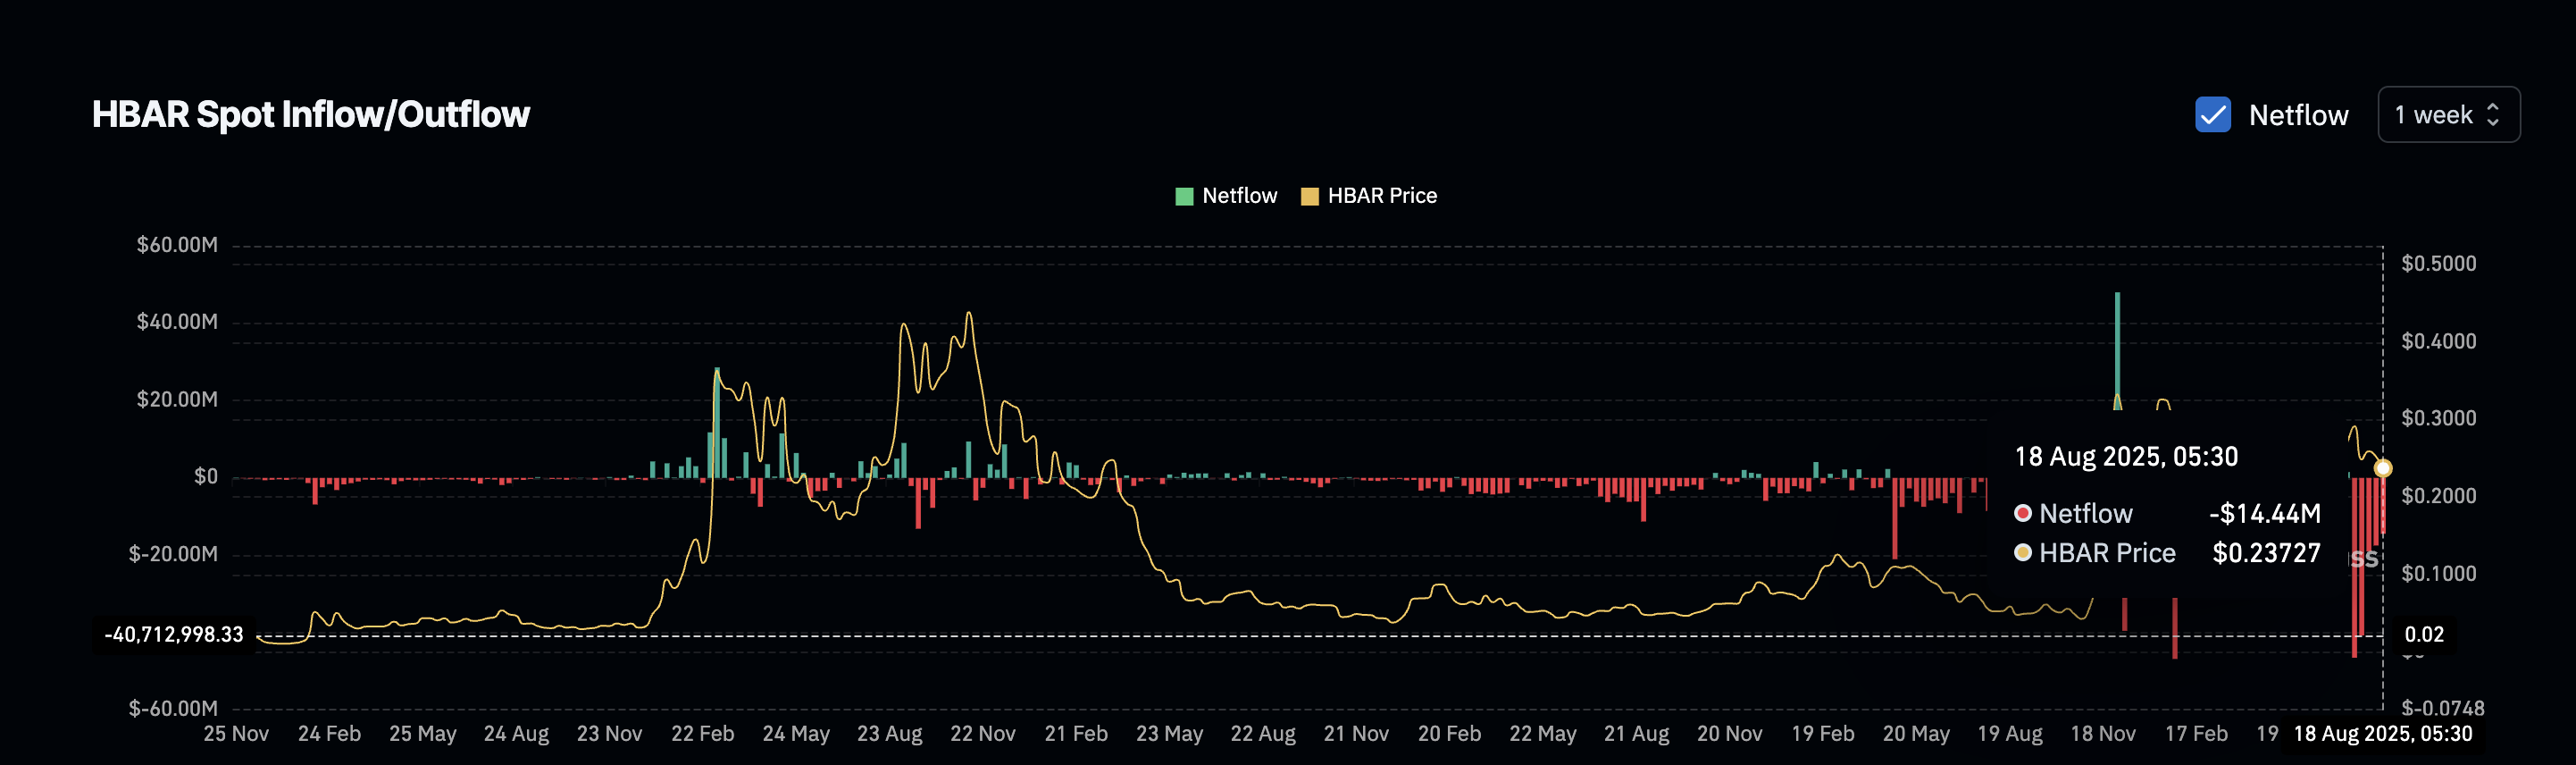
However, this short-term momentum contrasts with a broader sign of weakness: outflows are slowing. Over the past month, HBAR’s weekly net outflows, which reflect the volume of tokens leaving exchanges, have been falling steadily.
For token TA and market updates: Want more token insights like this? Sign up for Editor Harsh Notariya’s Daily Crypto Newsletter here.
Fewer tokens leaving exchanges suggests that fewer buyers are withdrawing to hold, a typical sign of reduced confidence. The slowing outflows confirm that buyers are still around — but they’re retreating.
So while HBAR RSI hints at a small recovery, it’s likely a short-term push, not a full reversal. The divergence may be a lone bullish sign in a space where buyer strength is fading fast.
Price Action Shows HBAR Is Stuck — But Not Hopeless
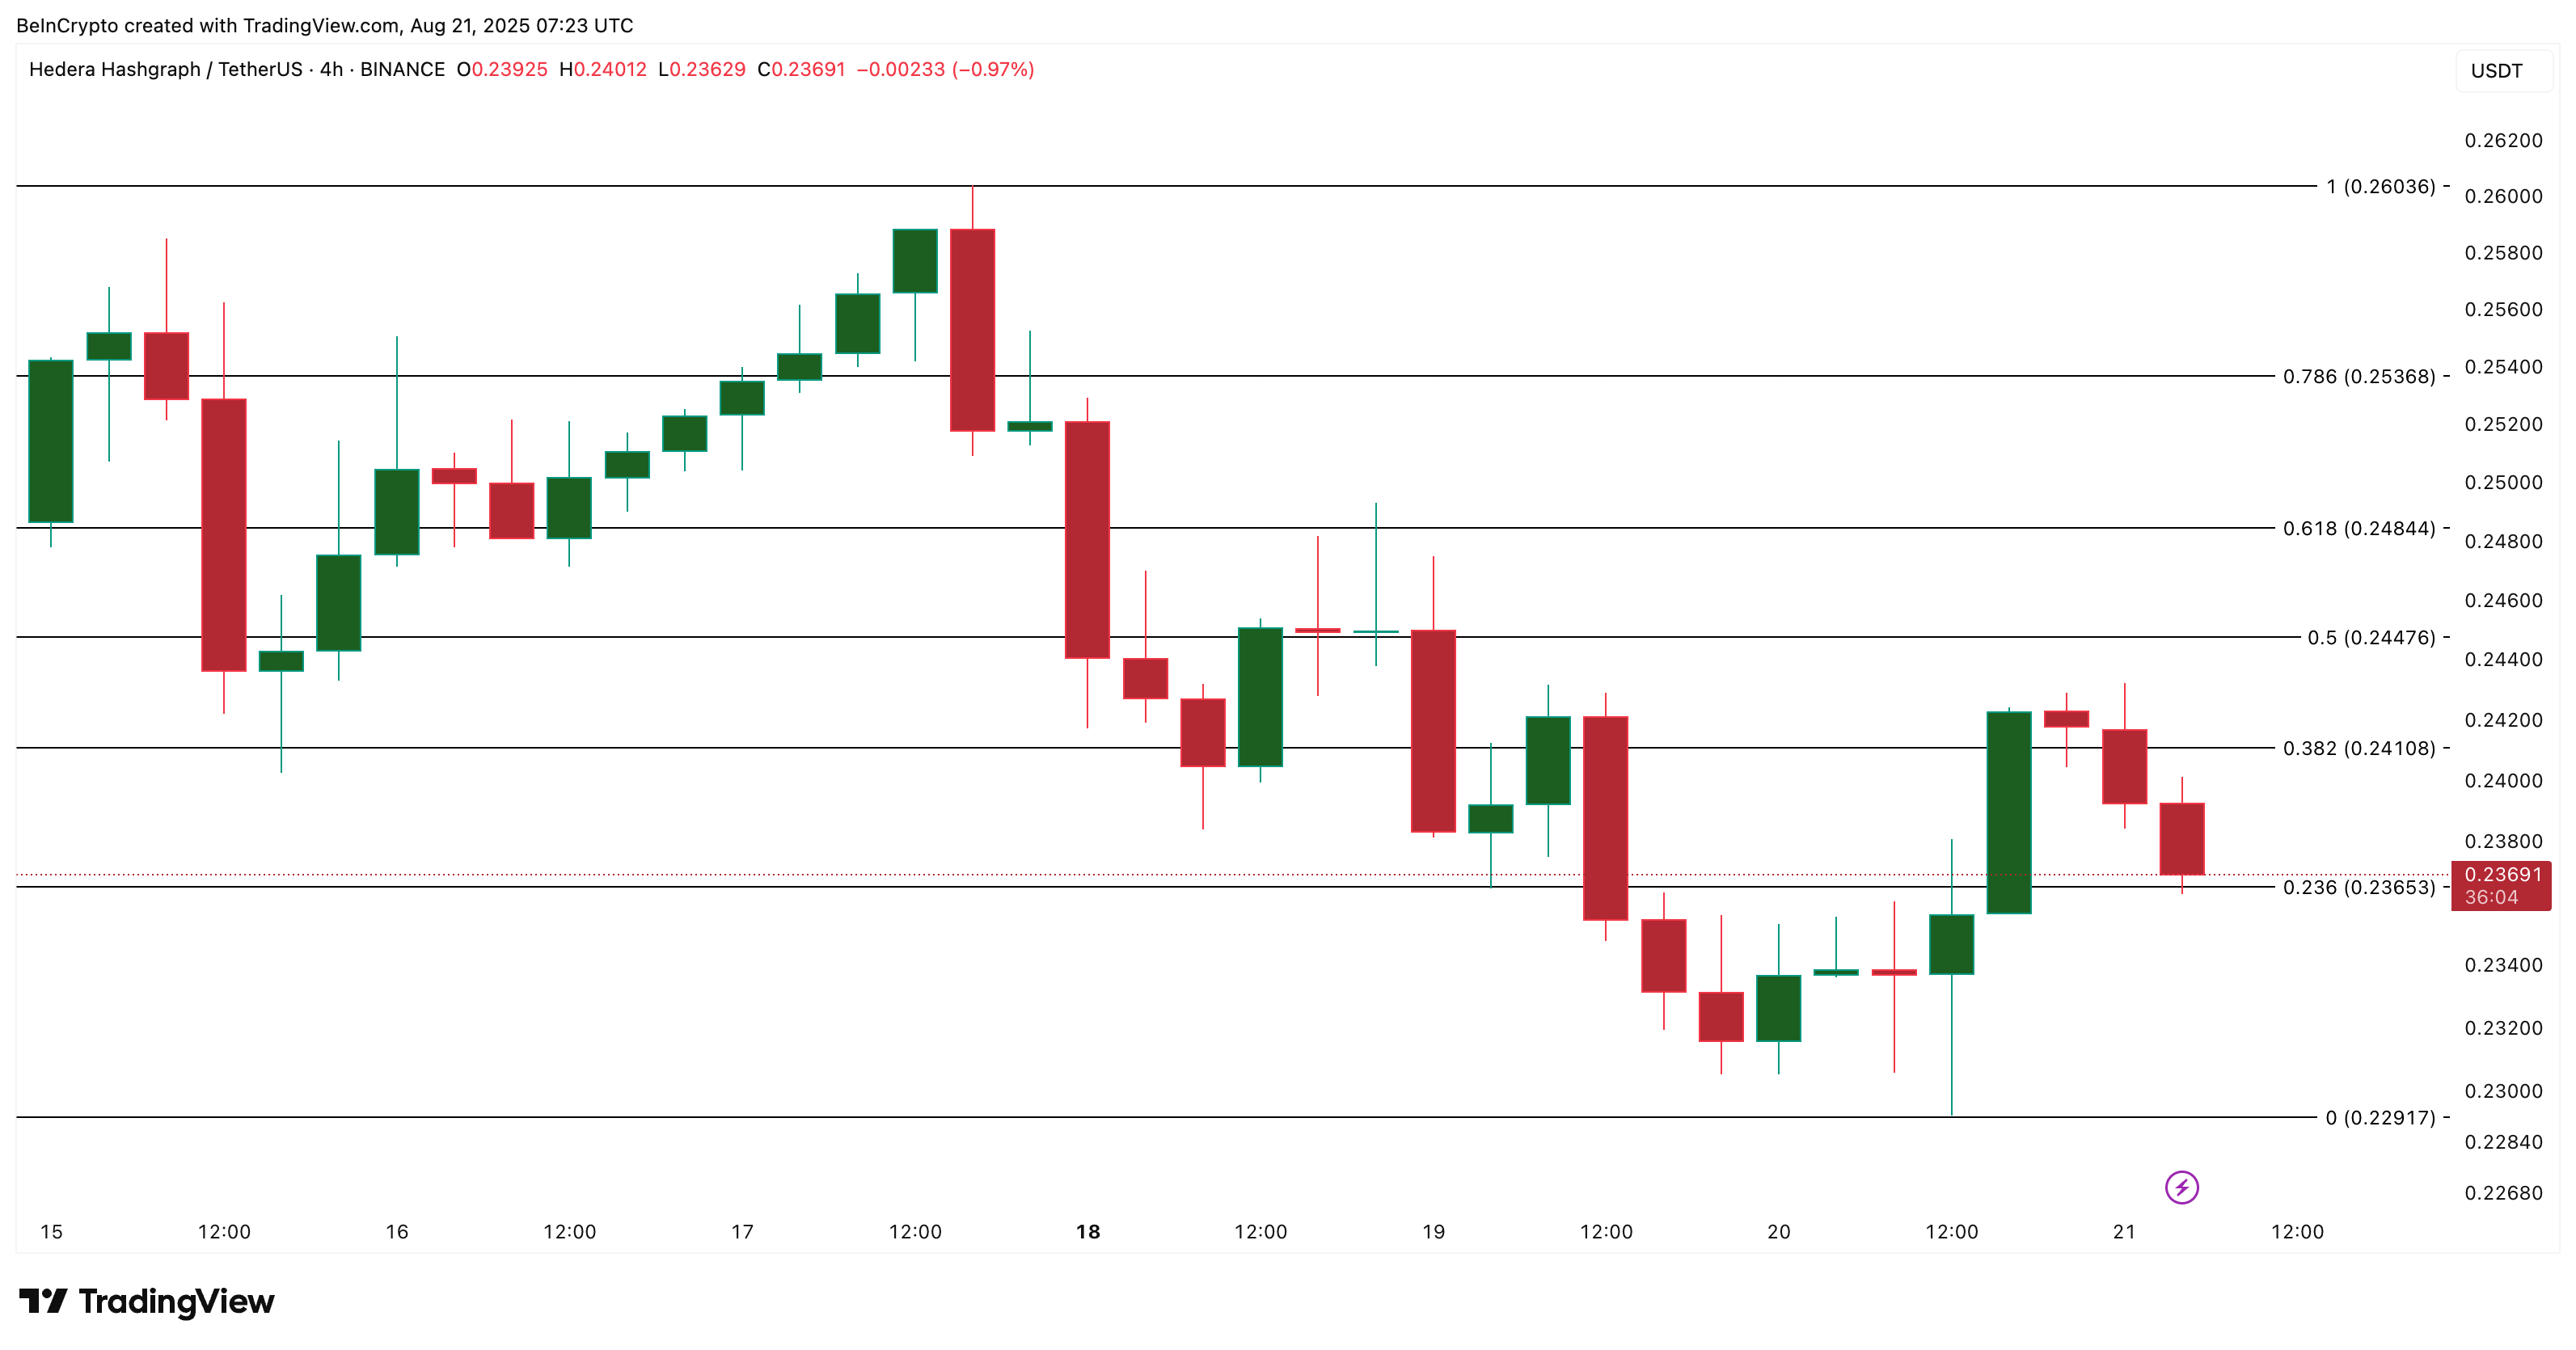
On the 4-hour timeframe, the HBAR price is hovering near a tight range between $0.236 and $0.241. The token has struggled to hold above this zone.
 HBAR price analysis:
TradingView
HBAR price analysis:
TradingView
If HBAR manages a clear candle close above $0.244, a short spike toward $0.253 or even $0.260 could be triggered, given the lack of strong resistance between those levels. But if it fails to hold on to the $0.236 level, the short-term bullish outlook pattern, and sellers likely regain complete control.
This RSI-backed setup is the only current bullish hope on the shorter timeframe, and even that comes with caution. Longer-term trends remain weak.
Disclaimer: The content of this article solely reflects the author's opinion and does not represent the platform in any capacity. This article is not intended to serve as a reference for making investment decisions.
You may also like
"Validator's Pendle" Pye raises $5 million, enabling SOL staking yields to be tokenized
There are truly no creative bottlenecks in the financialization of Web3.
DiDi has become a digital banking giant in Latin America
DiDi has successfully transformed into a digital banking giant in Latin America by addressing the lack of local financial infrastructure, building an independent payment and credit system, and achieving a leap from a ride-hailing platform to a financial powerhouse. Summary generated by Mars AI. This summary was produced by the Mars AI model, and its accuracy and completeness are still being iteratively improved.

Fed rate cuts in conflict, but Bitcoin's "fragile zone" keeps BTC below $100,000
The Federal Reserve cut interest rates by 25 basis points, but the market interpreted the move as hawkish. Bitcoin is constrained by a structurally fragile range, making it difficult for the price to break through $100,000. Summary generated by Mars AI This summary was generated by the Mars AI model, and the accuracy and completeness of its content are still being iteratively updated.
Full text of the Federal Reserve decision: 25 basis point rate cut, purchase of $4 billion in Treasury bills within 30 days
The Federal Reserve cut interest rates by 25 basis points with a 9-3 vote. Two members supported keeping rates unchanged, while one supported a 50 basis point cut. In addition, the Federal Reserve has restarted bond purchases and will buy $40 billion in Treasury bills within 30 days to maintain adequate reserve supply.