
Ethena Charts Bullish Path as Analysts Eye $1.00 Breakout


- Ethena shapes a second bull flag after a 27% dip, mirroring past rallies and signaling upside.
- Breakout projections target $0.705 first, with $1.00 as the next bullish objective.
- $5.31M in shorts near $0.664 risk liquidation, fueling a possible short squeeze.
Ethena has spent the past 10 days locked in a corrective phase, shedding more than half of the strong gains it built earlier in August. The pullback, however, has not dampened optimism among market watchers.
Instead, analysts point to recurring chart structures that echo Ethena’s earlier rallies, suggesting the token may be preparing for another decisive breakout. These patterns indicate that the recent pullback is less about market exhaustion and more about building momentum for the next upward move.
Historical Bull Flags Put Ethena on Path to $1.00
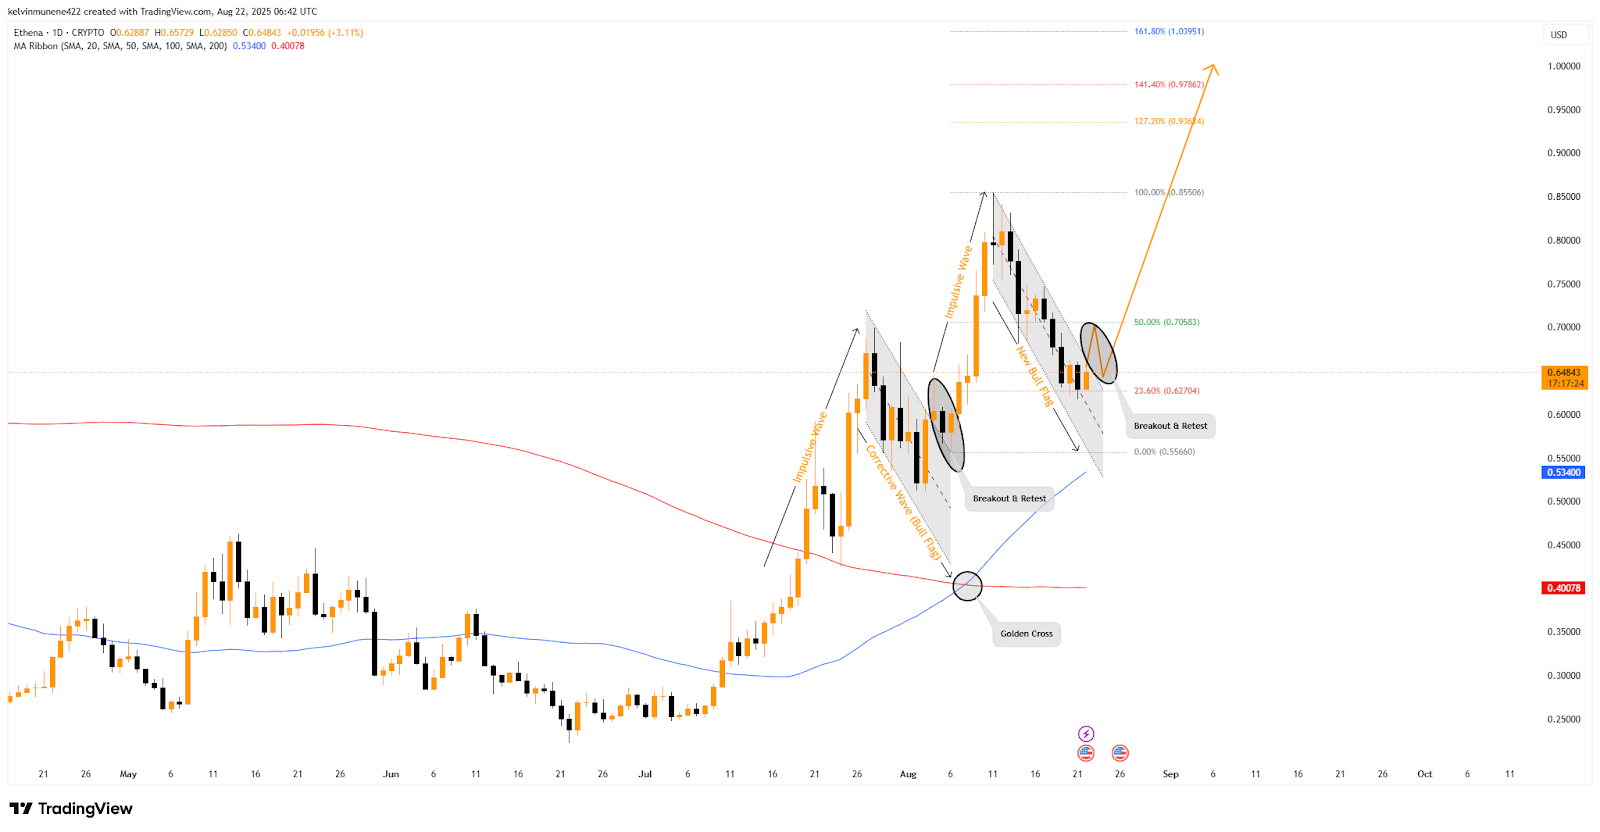
The token’s first major reversal began when it rallied from a low of $0.424 to a local high of $0.70, an impressive climb of more than 60%. That move, however, was followed by a sharp corrective phase. As a result, Ethena retraced 26%, sinking to $0.51, where it discovered firm support.
This pullback formed the first bull flag pattern. Once ENA’s price broke through the upper boundary of that flag and retested it successfully, traders recognized the move as a strong signal of renewed momentum. What followed was a powerful surge, with Ethena rallying 53% to reach a peak near $0.855.
 Source:
TradingView
Source:
TradingView
The current setup bears a striking resemblance to that earlier sequence. After touching the $0.855 mark, Ethena again entered a correction, this time dipping by 27%. This decline has shaped what analysts now consider the second bull flag on the daily chart.
Much like before, the token has begun climbing back, gaining 1.04% in the past 24 hours, and appears ready to break and retest the flag’s upper boundary. Market observers suggest that if this breakout follows the same pattern as the previous flag, Ethena could stage another strong rally.
The initial objective coincides with the 50% Fibonacci retracement level at $0.705. Should momentum ride on a successful retest of the breakout, it may carry momentum all the way to the 1.00 level. Based on the trading price of $0.648, this would give an upside of 53%.
Moving averages are providing further support through a golden cross resurgence. The 50-day MA, currently at $0.534, has crossed above the 200-day MA, reinforcing a long-term bullish outlook. The short-term average continues to increase, thus supporting the formation of steady upward momentum.
Technical Signals Show Buyers Slowly Taking the Lead
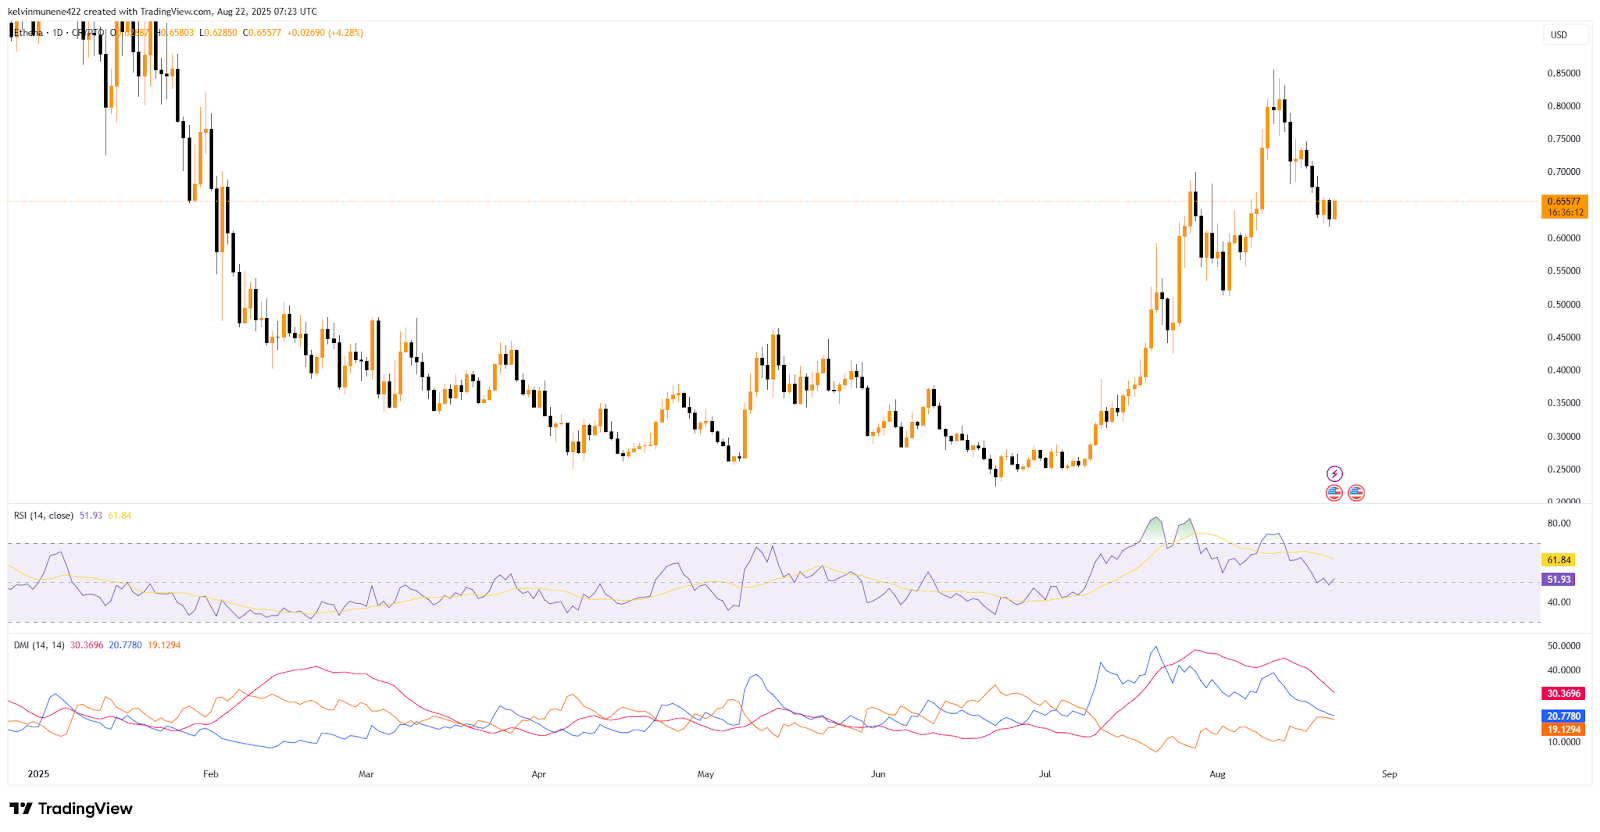
Technically, Ethena’s RSI is at 51.93, having cooled from overbought levels during its recent correction. However, momentum appears to be shifting back in its favor. The RSI has bounced off the neutral 50 mark and is now trending upward, signaling a potential return of buyer strength. The Directional Movement Index (DMI) does confirm this opinion.
 Source:
TradingView
Source:
TradingView
The +DI stands at 20.77, placed above the –DI at 19.12, indicating that buying pressure has theoretically overtaken selling pressure, yet only marginally. Even more importantly, the ADX is showing a reading of 30.36, which signals that the current trend is not only intact but gaining strength.
Related: KAS Price Holds Near Key Support as On-Chain Data Turns Bullish
Breakout Could Spark Ethena Short Squeeze
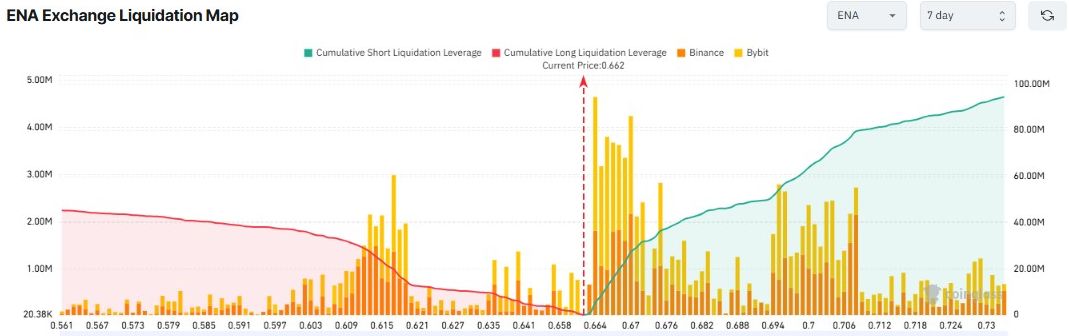
Liquidation data reveal that approximately $5.31 million in short positions are clustered around the $0.664 level, just above the current price of $0.645. A breakout of this area may create a cascade of short liquidations, which may contribute to a short squeeze.
 Source:
Coinglass
Source:
Coinglass
This would likely prompt a substantial increase in purchasing pressure and propel the token to the 50% Fib retracement level, preconditioning the breakout-and-retest pattern that analysts have been looking forward to.
Conclusion
Ethena is at a critical juncture, with technical indicators and price action suggesting the possibility of the resurgence of momentum. Although short-term fluctuations cannot be ruled out, the landscape is pointing to strength. Should buyers take advantage of this positioning, the token might be on the brink of its next critical rally.
The post Ethena Charts Bullish Path as Analysts Eye $1.00 Breakout appeared first on Cryptotale.
Disclaimer: The content of this article solely reflects the author's opinion and does not represent the platform in any capacity. This article is not intended to serve as a reference for making investment decisions.
You may also like
![[Bitpush Daily News Selection] Li Lin, Shen Bo, Xiao Feng, and Cai Wensheng plan to jointly establish a $1 billion Ethereum treasury company; Federal Reserve's Musalem: May support another rate cut, policy not predetermined; Charles Schwab: Clients' interest in its crypto products is rising, with crypto site visits up 90% year-on-year](https://img.bgstatic.com/multiLang/image/social/8adb0f5428cbad636affb1d78db93e2b1760758383908.png)
When Tether Becomes More Valuable Than ByteDance: Who Is Paying for the Crypto World's "Money Printer"?
Tether’s pursuit of a $500 billion valuation has sparked controversy. Its high profits rely on the interest rate environment and stablecoin demand, but it faces challenges related to regulation, competition, and sustainability. Summary generated by Mars AI. This summary is produced by the Mars AI model, and the accuracy and completeness of the generated content are still in an iterative update phase.

French Banking Titan Launches Groundbreaking Stablecoin Tied to the Euro
In Brief ODDO BHF launches Euro-pegged stablecoin EUROD on Bit2Me for broad market access. EUROD aligns with E.U.'s MiCA framework, enhancing trust with bank support. EUROD aims to fill corporate demand and diversify currency in a dollar-dominated arena.
Top 3 Altcoins Set for Huge Gains — Buy Before the Next Rally

Trending news
MoreThe private key to $15 billion worth of Bitcoin was accidentally cracked by the US.
[Bitpush Daily News Selection] Li Lin, Shen Bo, Xiao Feng, and Cai Wensheng plan to jointly establish a $1 billion Ethereum treasury company; Federal Reserve's Musalem: May support another rate cut, policy not predetermined; Charles Schwab: Clients' interest in its crypto products is rising, with crypto site visits up 90% year-on-year