One Bullish Pattern Could Launch Ethereum (ETH) Price Toward $4,770

Ethereum price fell over 6% in the past week but is showing early signs of strength. Short-term holders are buying again, profit-taking has slowed, and an inverse head and shoulders pattern on the chart hints at a possible breakout.
Ethereum has had a rough week, slipping almost 6.2% in the past seven days. Most analysts have been calling for further correction, but the token has managed to steady itself. Over the past 24 hours, the Ethereum price is up a small 0.1%, trading in neutral territory.
While this move alone doesn’t change much, a mix of on-chain and chart signals suggests something more interesting may be building.
Short-Term Holders Step Back In
One sign of renewed strength comes from short-term wallets. These are addresses that typically hold ETH for a few days or weeks before selling. After weeks of trimming exposure, this group has started buying again.
 ETH Buying Gets Back On Track:
Glassnode
ETH Buying Gets Back On Track:
Glassnode
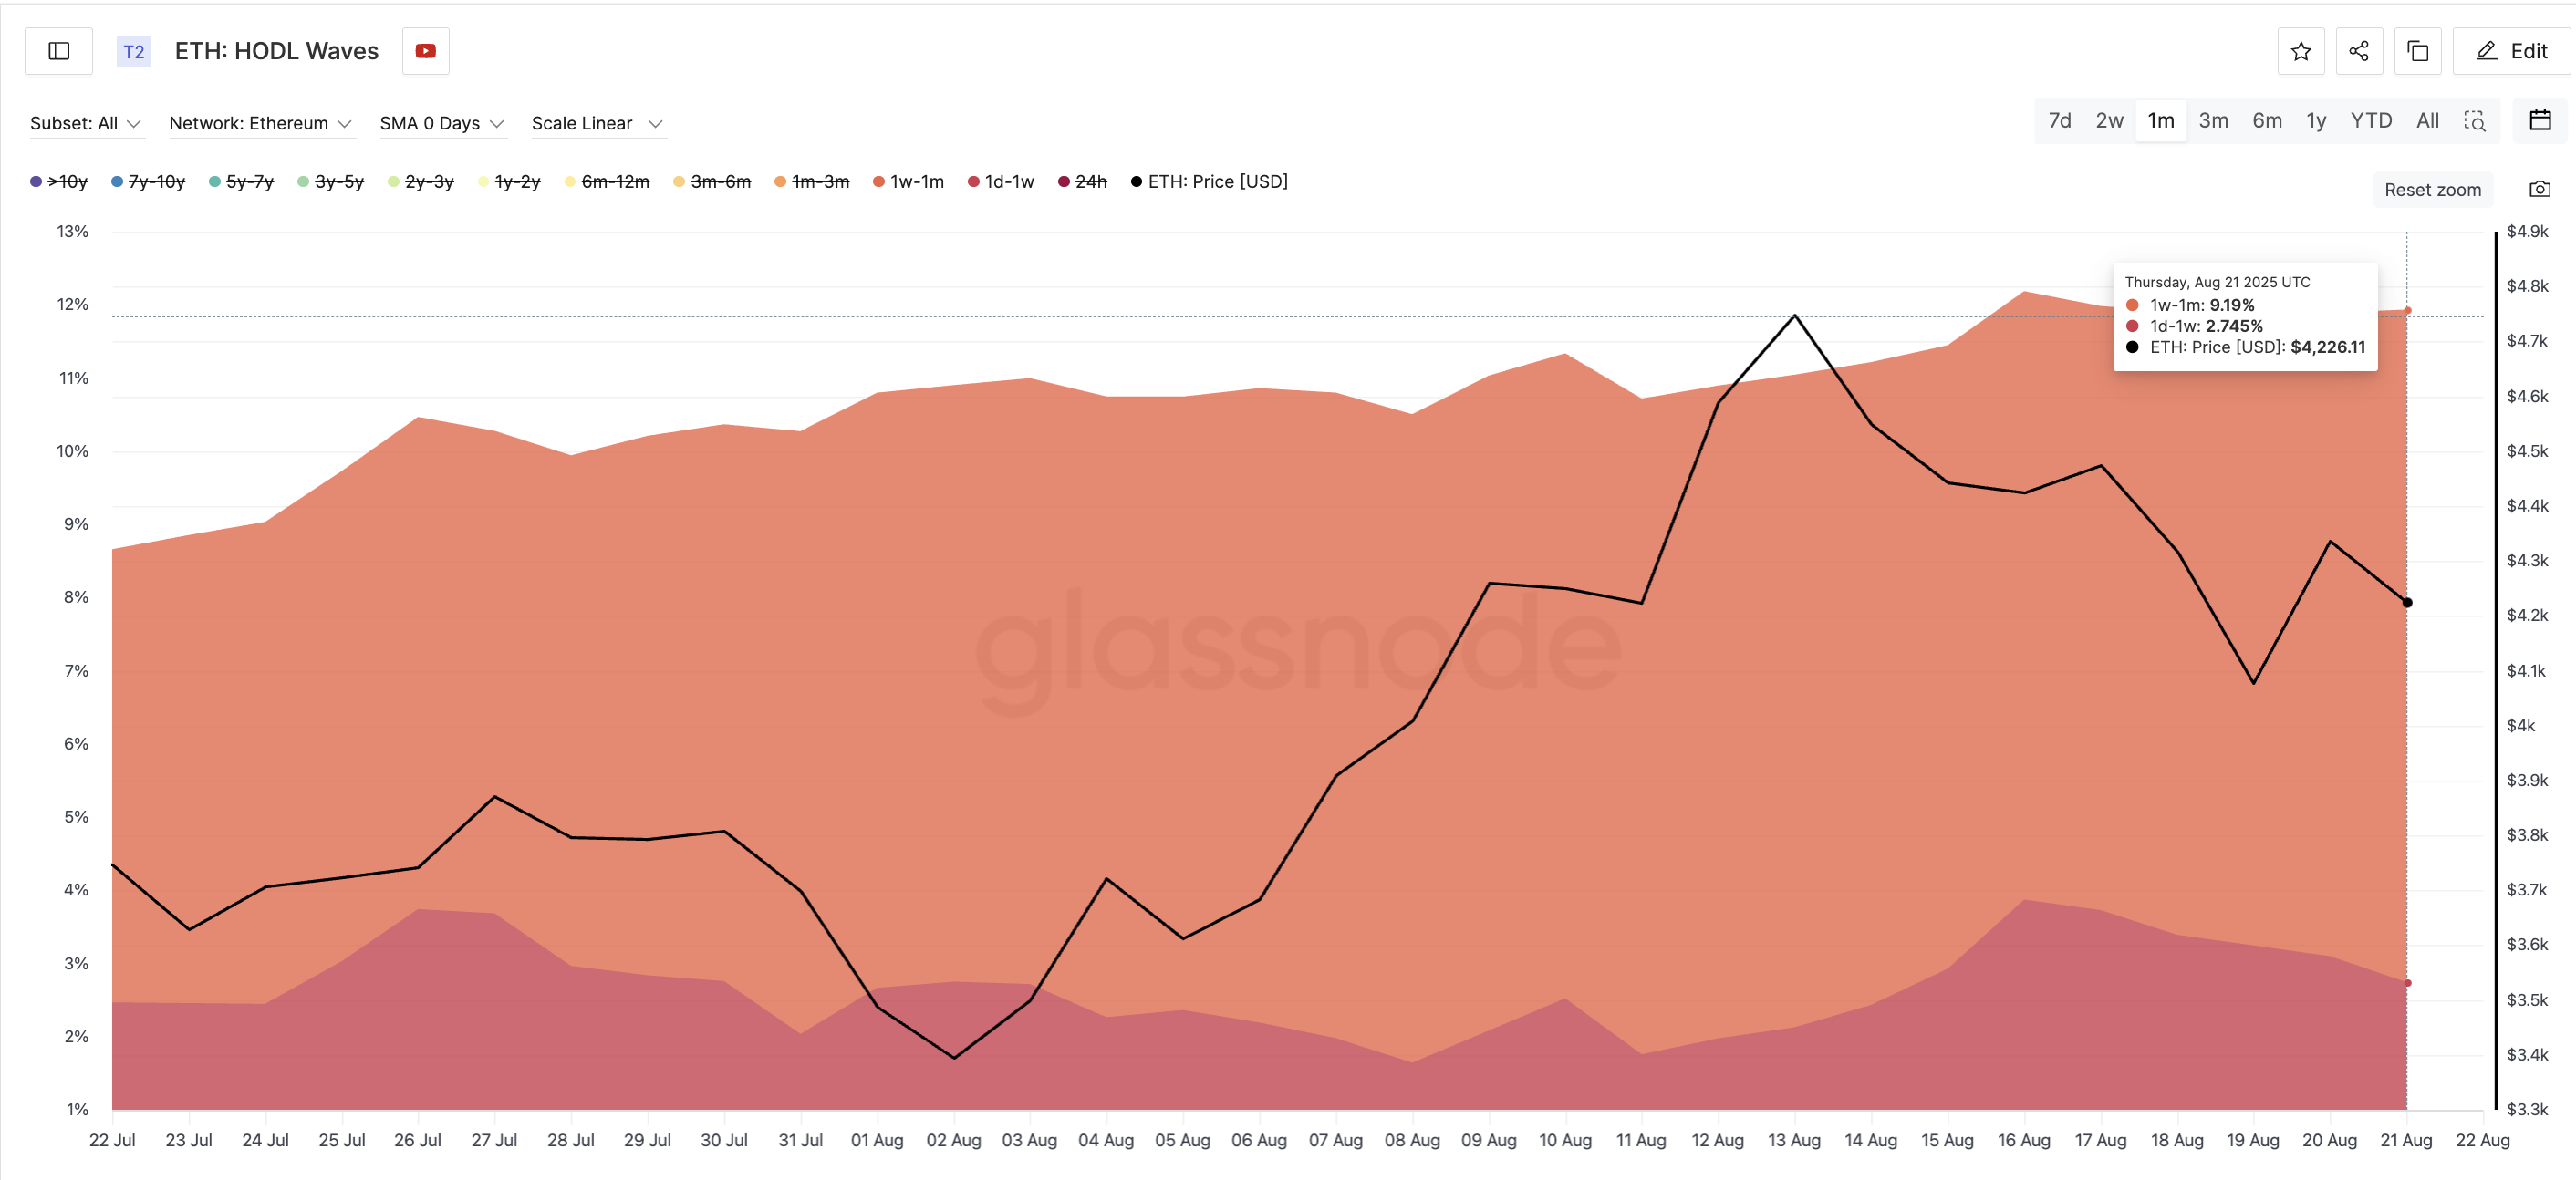
Data shows that 1-week to 1-month holders grew their share of ETH supply from 6.9% on July 22 to 9.19% on August 21. At the same time, 1-day to 1-week holders rose from 1.64% on August 8 to 2.74% on August 21. That represents a 67% increase in just two weeks, a clear indication that fresh buying pressure is returning.
HODL Waves show the share of coins held across different time bands, from a few days to several years. It helps reveal whether short-term traders or long-term holders are driving market activity.
Why does this matter? These short-term cohorts are often the first to react when they see an opportunity. Their renewed activity suggests confidence that the ETH price may have found a local floor and could be gearing up for the next move higher.
For token TA and market updates: Want more token insights like this? Sign up for Editor Harsh Notariya’s Daily Crypto Newsletter here.
SOPR Hints at Market Bottom
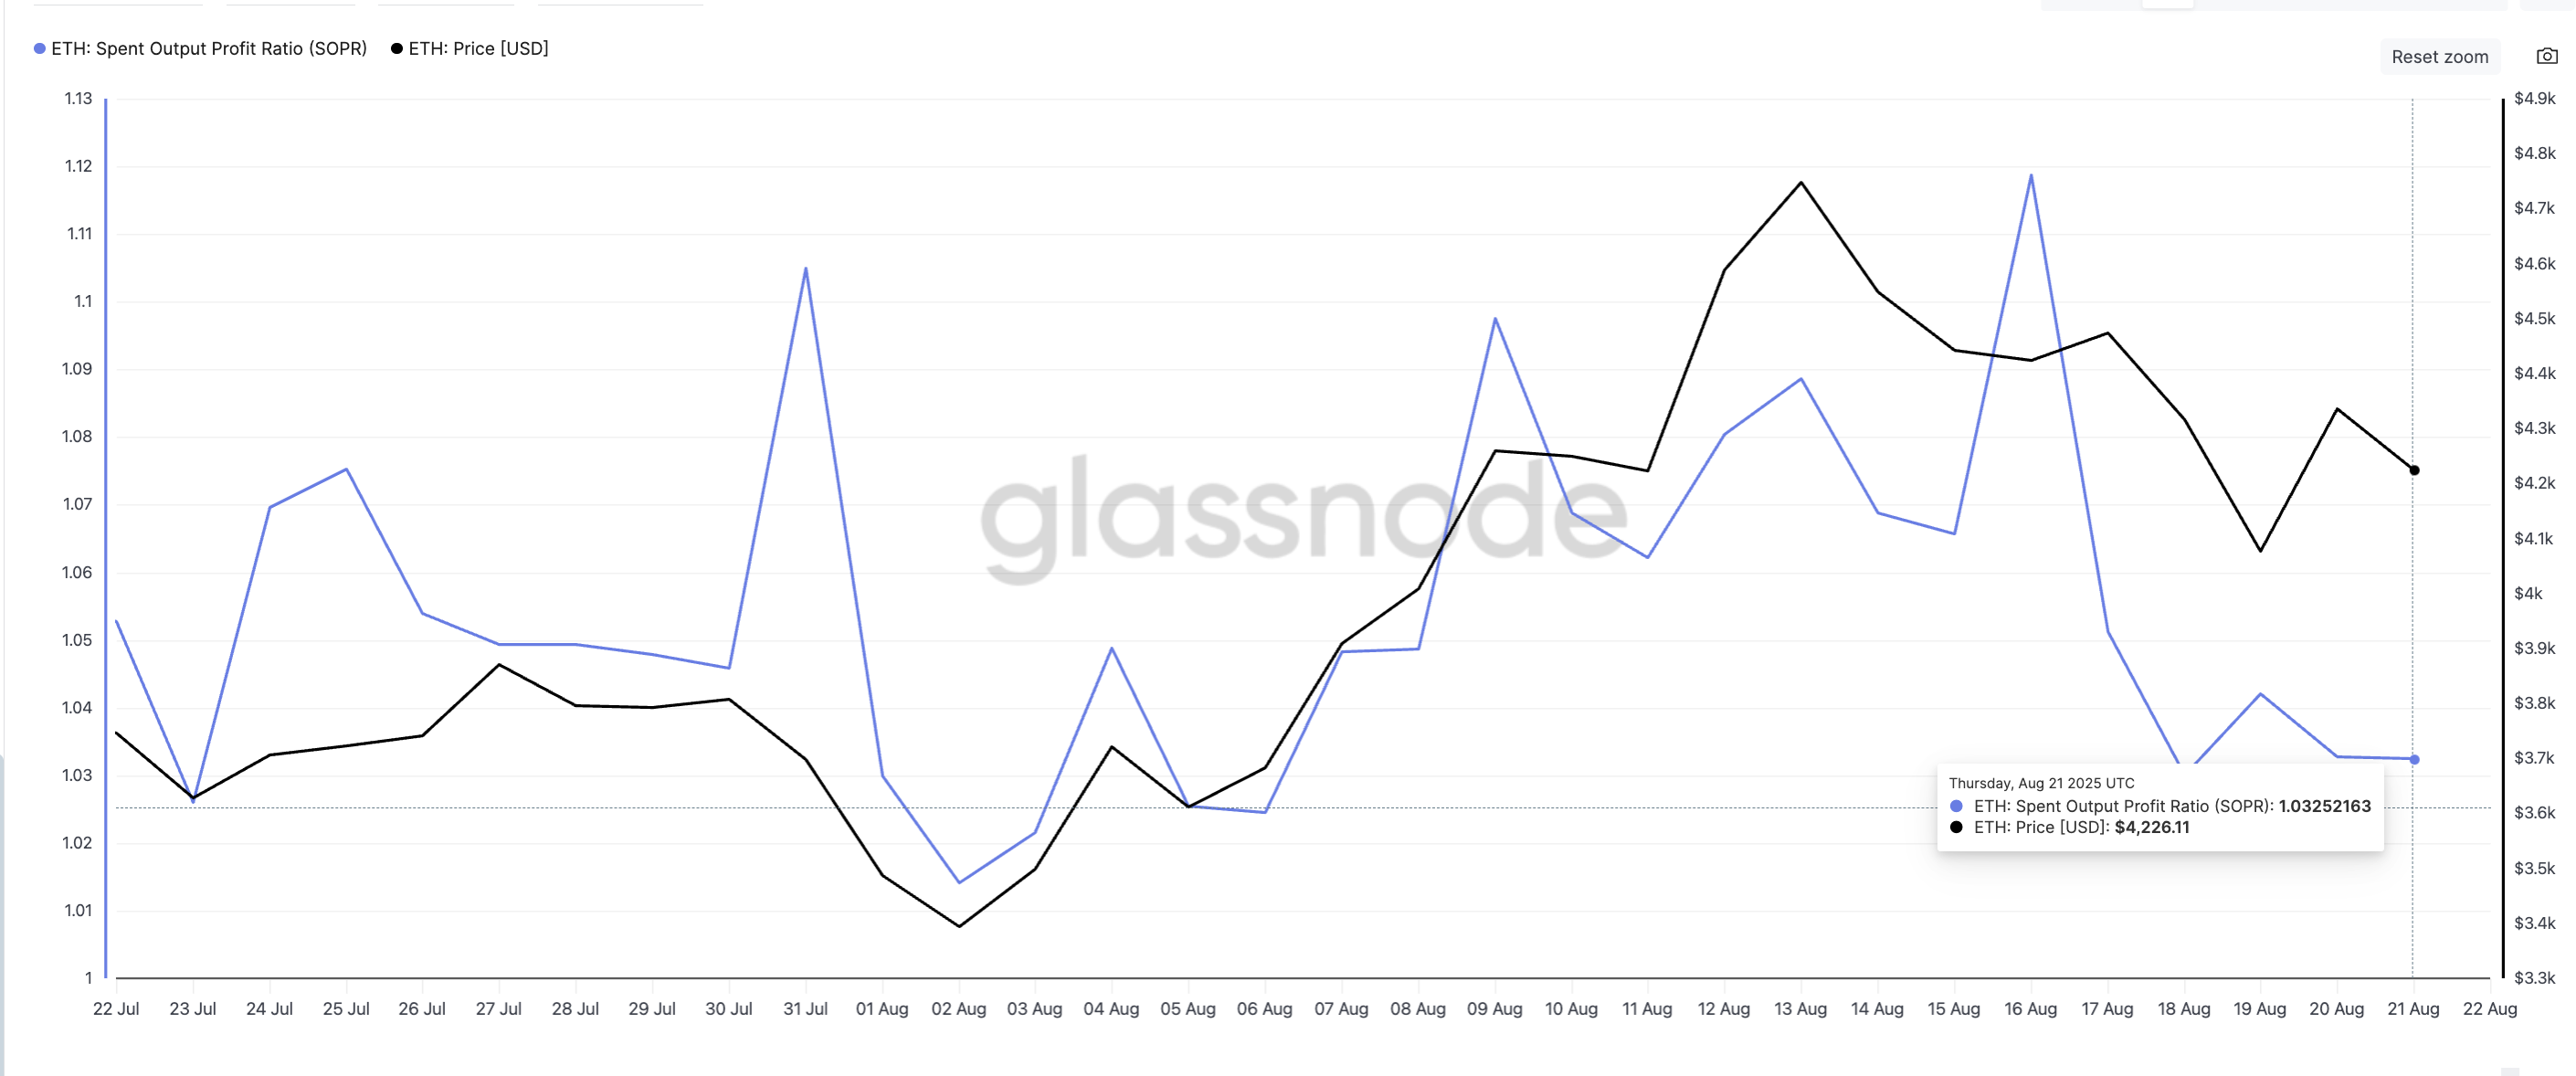
Another piece of the puzzle comes from the Spent Output Profit Ratio (SOPR), a metric that tracks whether coins moving on-chain are being sold at a profit or a loss. When SOPR is high, it means holders are cashing out in profit. When it drops closer to 1 or below, more so with the prices correcting, it shows sellers are taking fewer profits, often near local bottoms.
 ETH Price And SOPR:
Glassnode
ETH Price And SOPR:
Glassnode
Over the past week, ETH’s SOPR dropped from 1.11 to 1.03. A similar move was last observed on July 31, when the ratio decreased from 1.10 to 1.01. At the time, the drop marked a market bottom. ETH bounced from $3,612 to $4,748 in the following days — a 31% rally.
A similar setup may be forming now. The SOPR decline suggests profit-taking is drying up while sellers weaken, creating the conditions for buyers to step back in. If history repeats, this could be the early signal of another Ethereum price rally.
Inverse Head And Shoulders Ethereum Price Pattern in Play
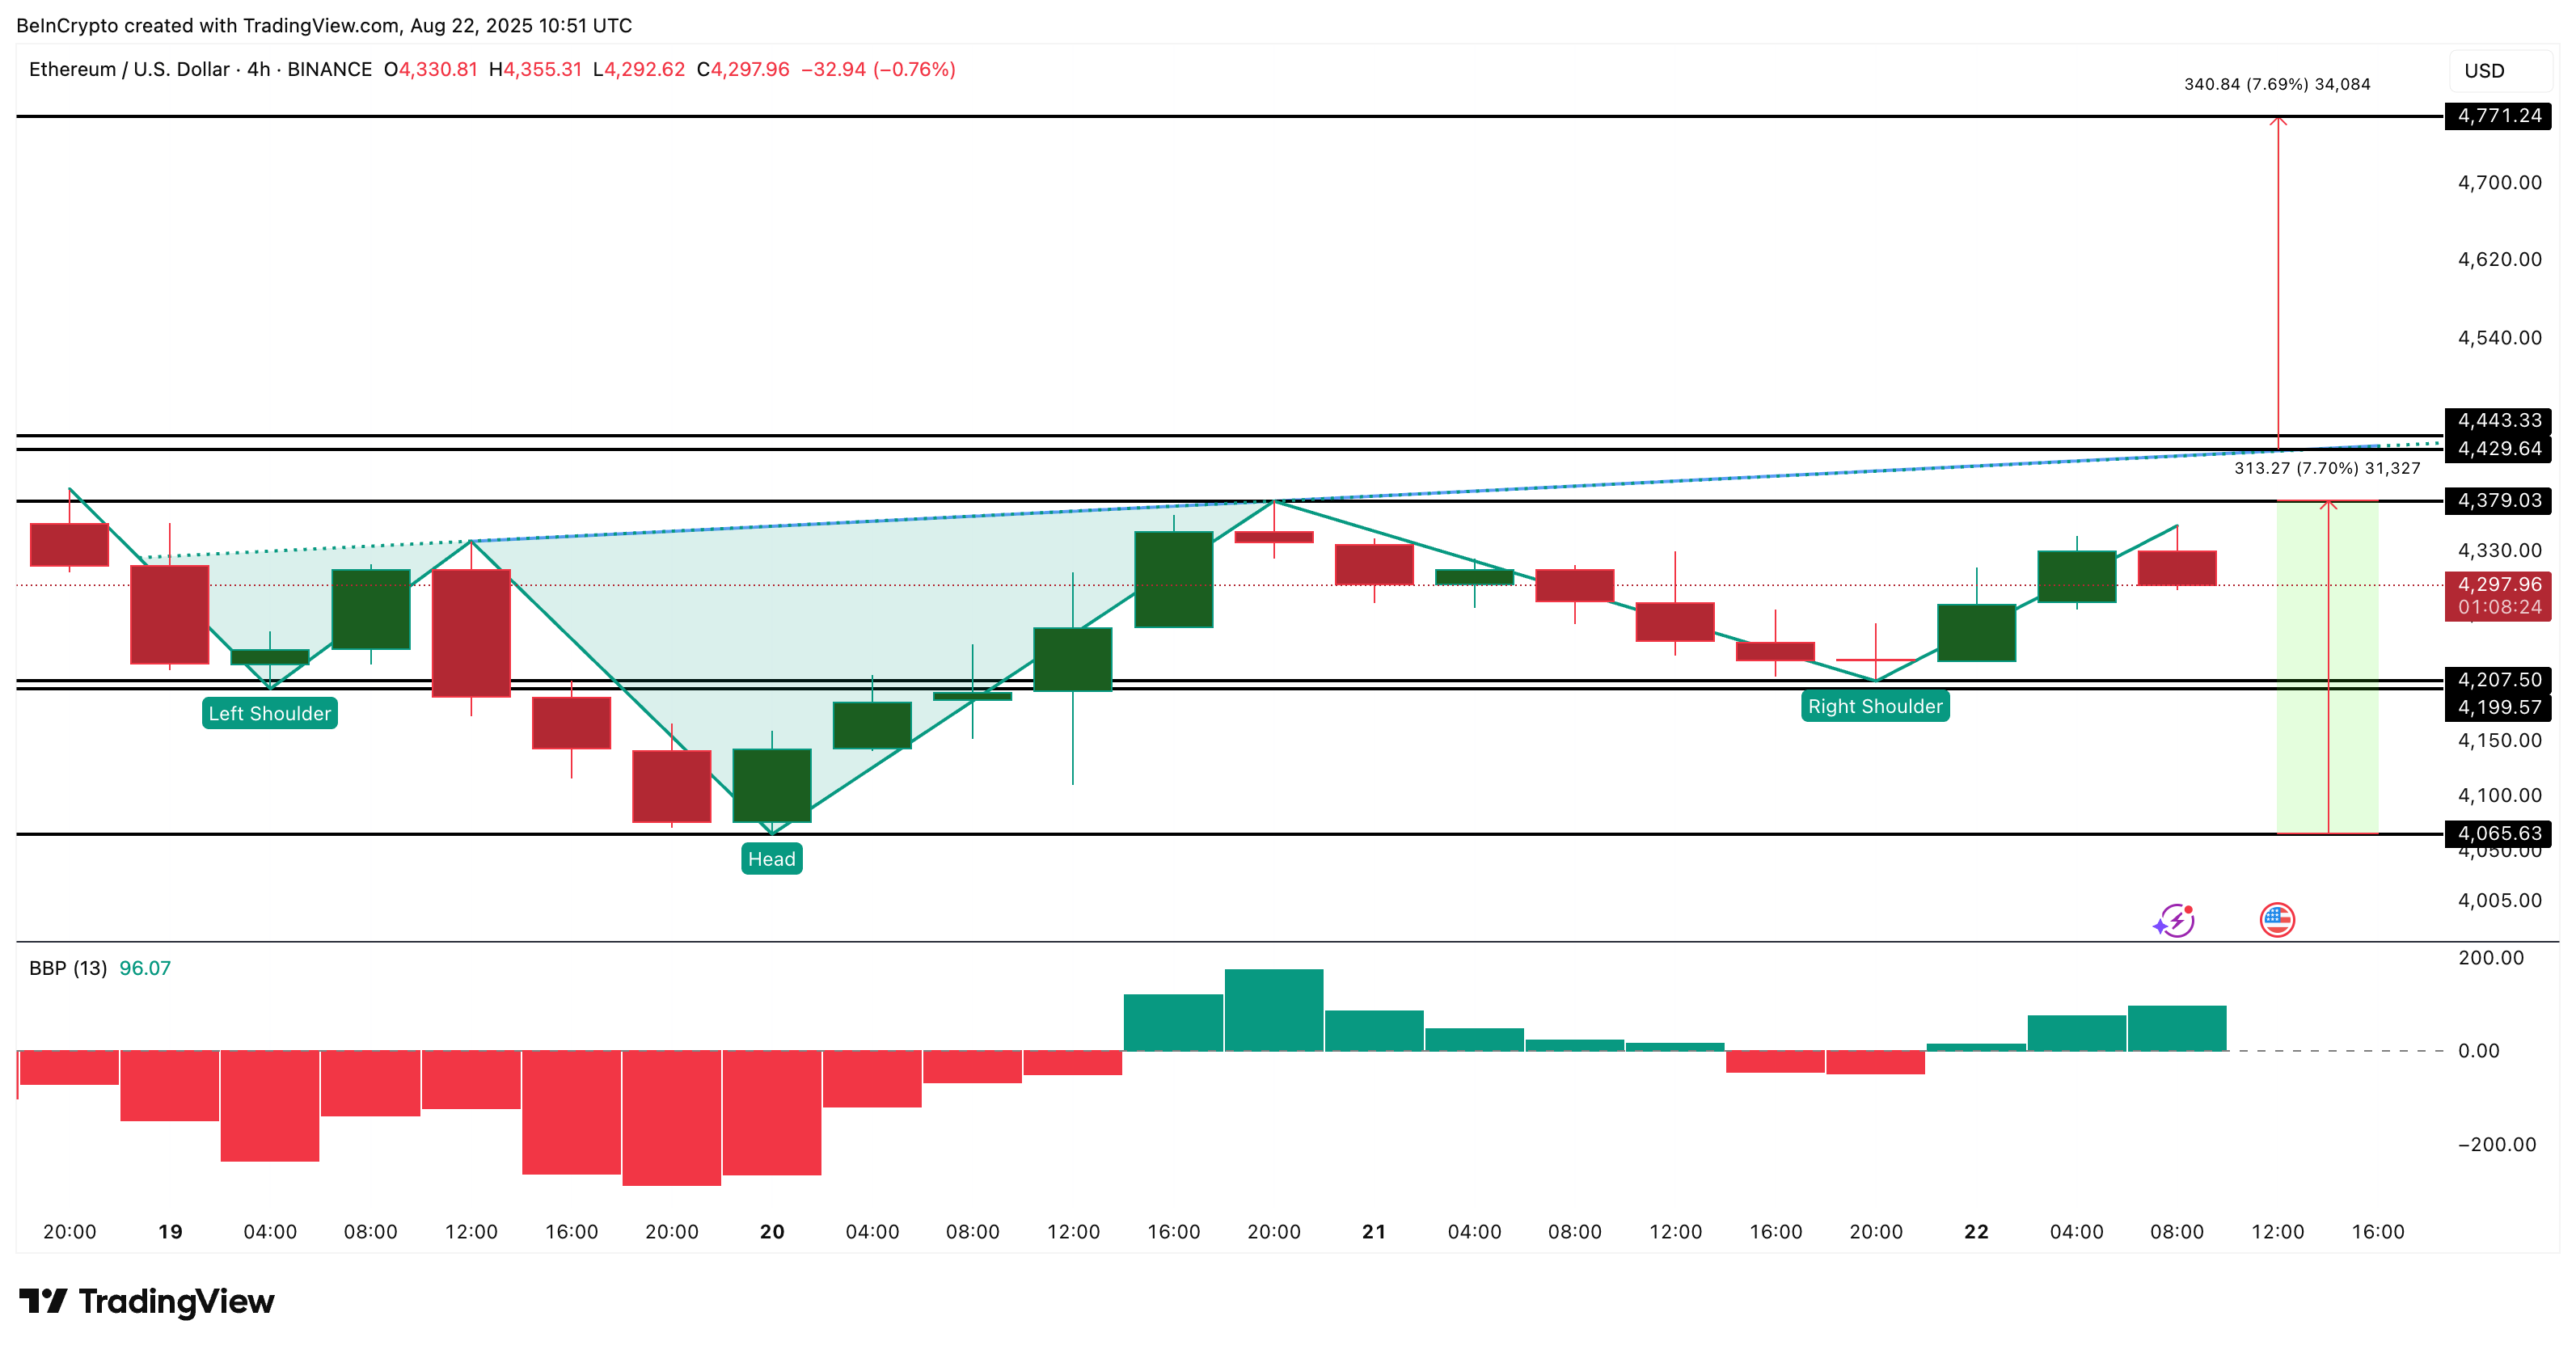
Beyond on-chain signals, the price chart itself is flashing a strong setup. On the 4-hour chart, ETH is forming an inverse head and shoulders pattern, a classic bullish reversal signal. The neckline of this pattern sits near $4,379 and is slightly sloping upward, which often strengthens the breakout case.
 Ethereum Price Analysis:
TradingView
Ethereum Price Analysis:
TradingView
For confirmation, the ETH price needs to clear $4,443. If that happens, the technical target points toward $4,770, calculated from the distance between the neckline and the head. This lines up with the broader bullish signals from short-term buyers and SOPR. Even the increase in the bullish momentum, while the Ethereum price flirts with a breakout pattern, strengthens the bullish case.
The increase in bullish momentum can be exhibited by the rising green bars in the Bull Bear Power indicator, which measures the gap between the highest price and a moving average to show whether buyers or sellers are in control.
Still, traders should watch the invalidation level. If ETH slips below $4,207 (the base of the right shoulder), the pattern fails and the bullish thesis weakens.
Disclaimer: The content of this article solely reflects the author's opinion and does not represent the platform in any capacity. This article is not intended to serve as a reference for making investment decisions.
You may also like
samczsun: The Key to Crypto Protocol Security Lies in Proactive Re-Auditing
Bug bounty programs are passive measures, while security protection requires proactive advancement.

Millennials with the most cryptocurrency holdings are reaching the peak of divorce, but the law is not yet prepared.
The biggest problem faced by most parties is that they have no idea their spouse holds cryptocurrency.

Using "zero fees" as a gimmick, is Lighter's actual cost 5–10 times higher?
What standard accounts receive from Lighter is not free trading, but rather slower transactions. This delay is turned into a source of profit by faster participants.

Prize pool of 60,000 USDT, “TRON ECO Holiday Odyssey” annual ecological exploration event is about to begin
TRON ECO is launching a major ecosystem collaboration event during Christmas and New Year, offering multiple luxurious benefits across the entire ecosystem experience!